BBCR: Climate Resilience for SMEs
Designing a mission-critical disaster preparedness tool for small businesses in high-risk flood zones.
Client
UNEP DTU Partnership / ADPC
Year
2018–2021
Role
Product Lead & UX Researcher
The Challenge: Designing for Life and Livelihood
SMEs in Sri Lanka are the backbone of the economy but are devastated by annual flooding. My role was to lead the product strategy and UX for a mobile tool that helps these business owners move from reactive survival to proactive resilience. The primary challenge was building trust with users who had low digital literacy and limited access to stable internet .
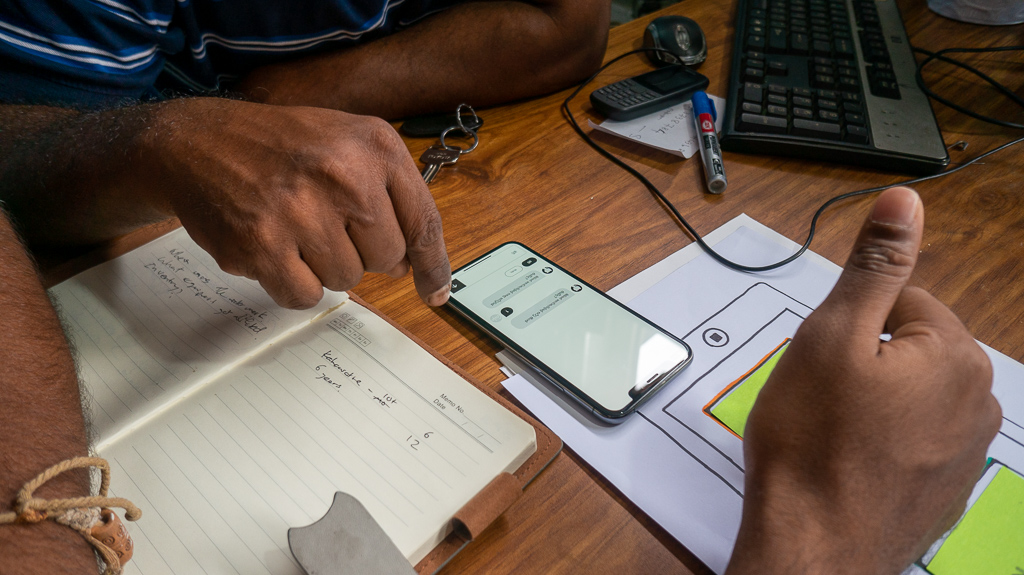
In-field user testing session: an SME participant at a desk pointing to the prototype on an Android phone beside a notebook and hand-drawn app wireframes, illustrating the co-creation workshop setup.
Field Research: Insights from the Flood Zone
I led on-the-ground co-creation workshops in Colombo, Kandy, and Galle to understand the daily workflows of SME owners. We discovered that most owners lacked formal preparedness plans not due to apathy, but due to information overload. This led to a "Action-First" design philosophy: stripping away abstract climate data and focusing on immediate, tangible checklists .
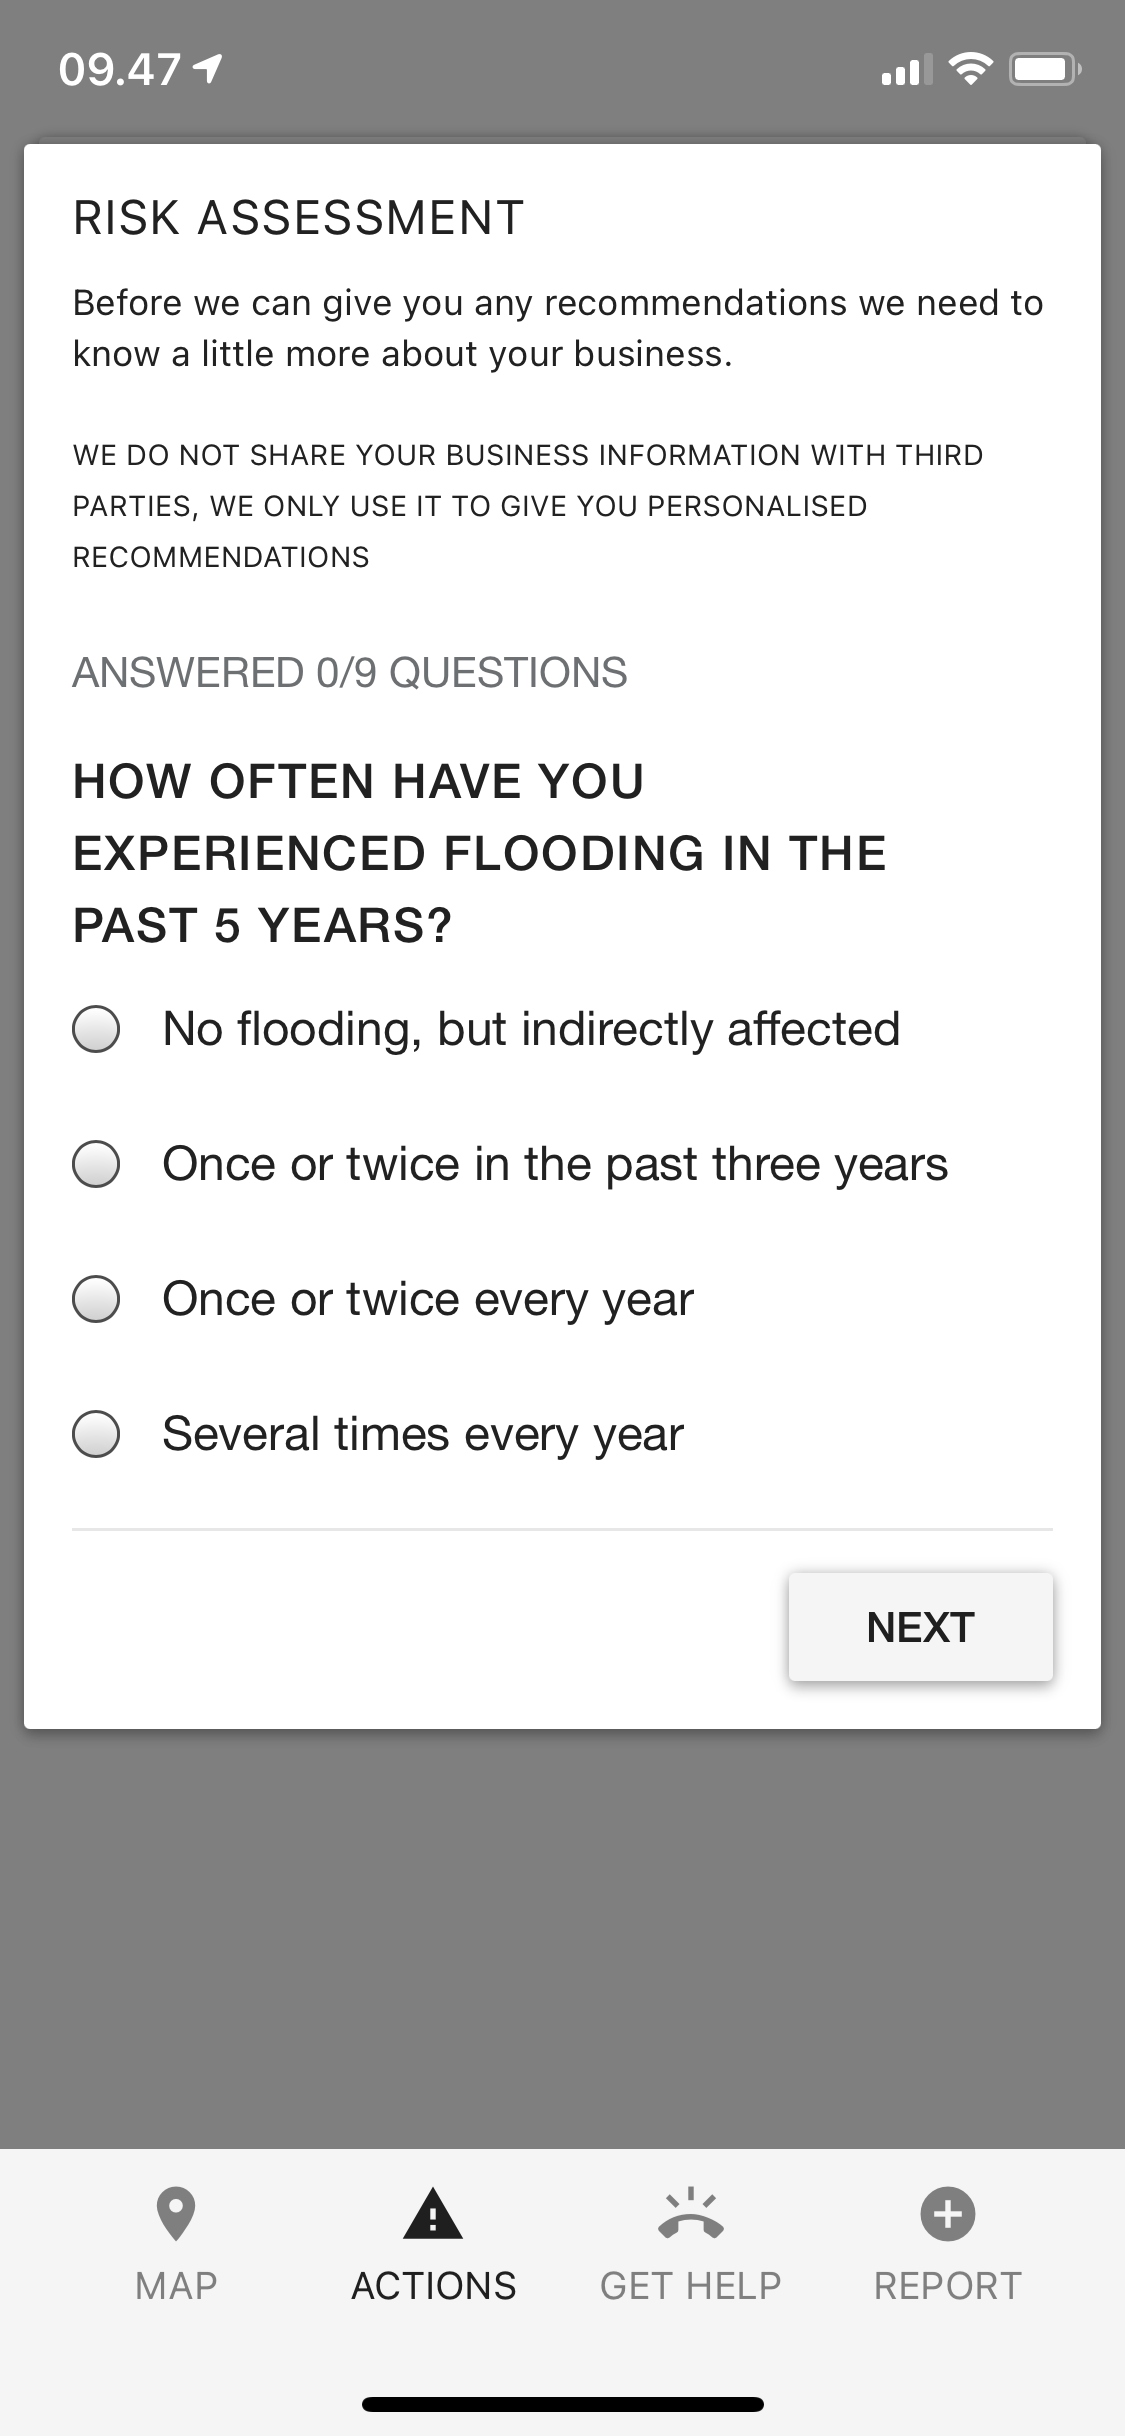
“Risk Assessment” modal under the “Actions” tab prompting the SME user with “How often have you experienced flooding in the past 5 years?” and four radio-button options.
UX Strategy: Visualizing Invisible Risks
I designed a "Map & Forecast" module that translates complex GeoJSON rainfall data into simple, color-coded alerts , . By visualizing precipitation in a 3-day window, we gave business owners a clear "window of action" to move inventory or protect equipment before the rain started .
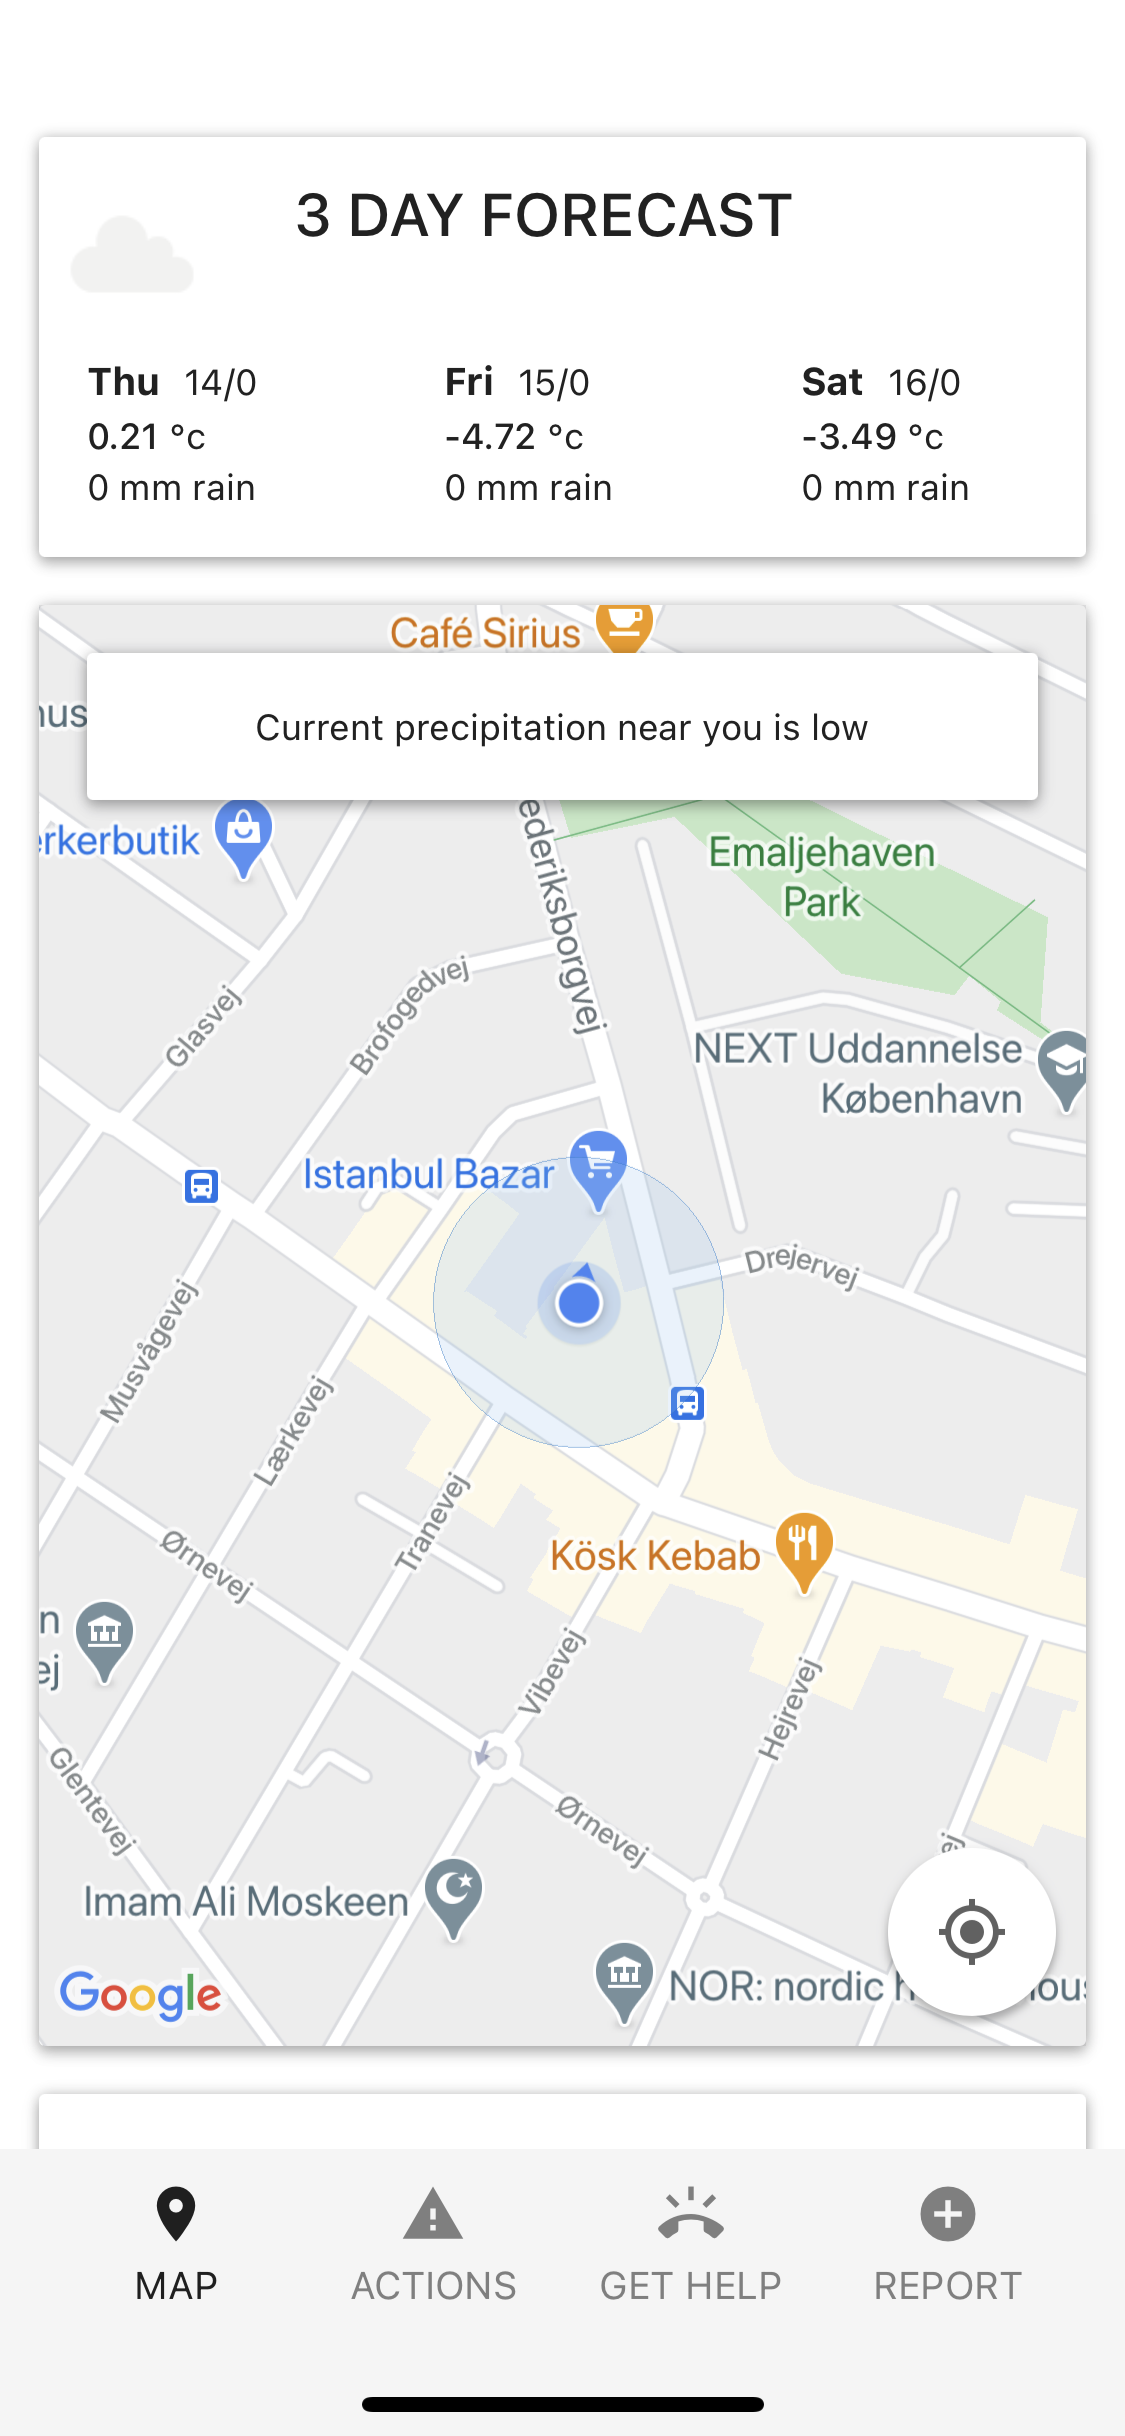
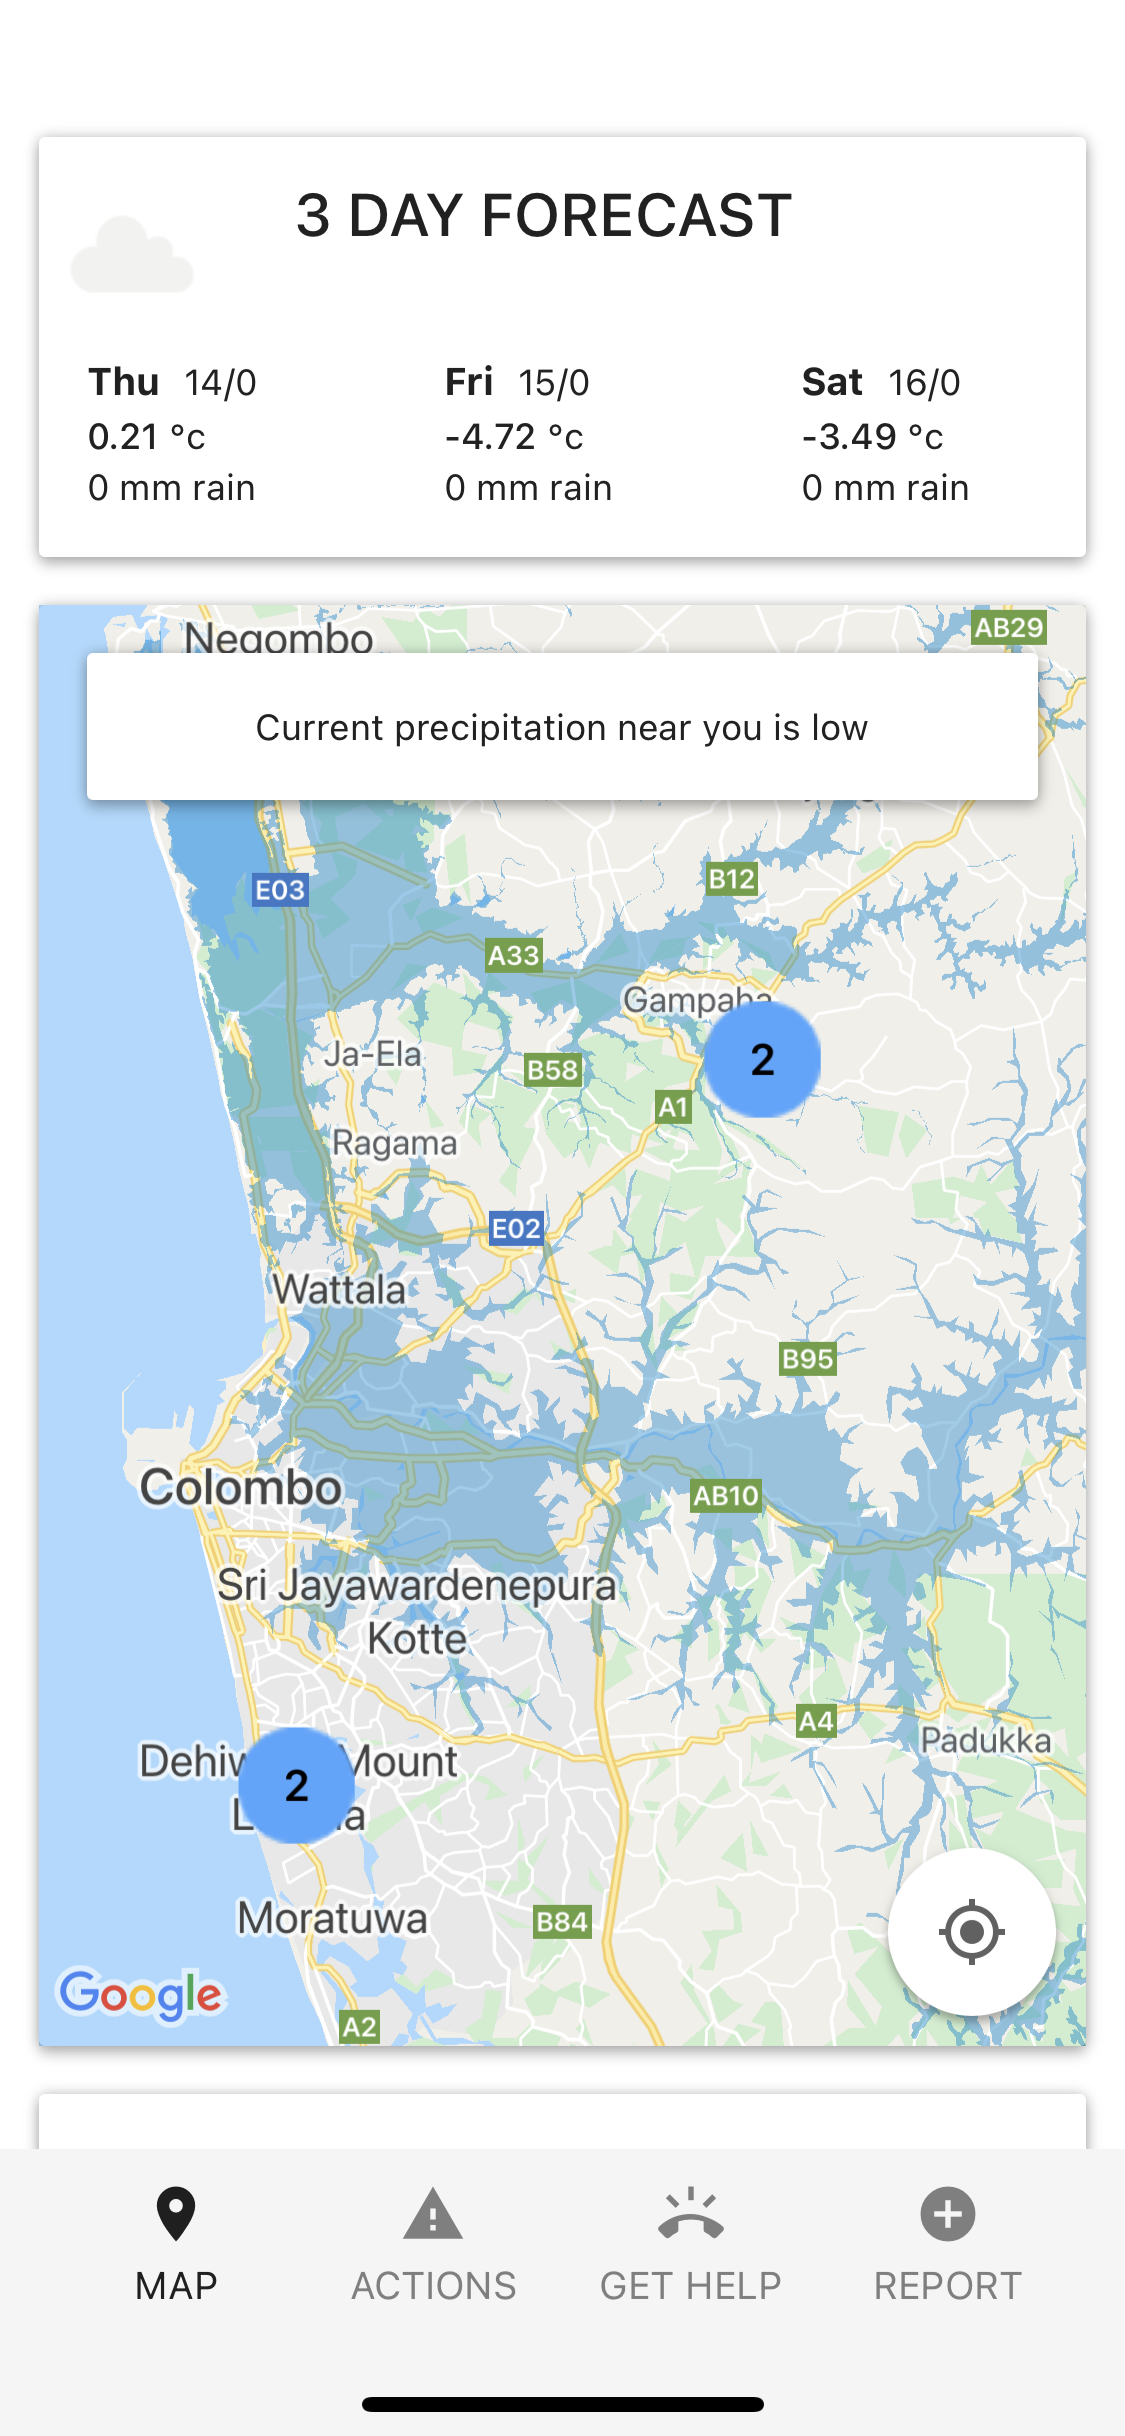
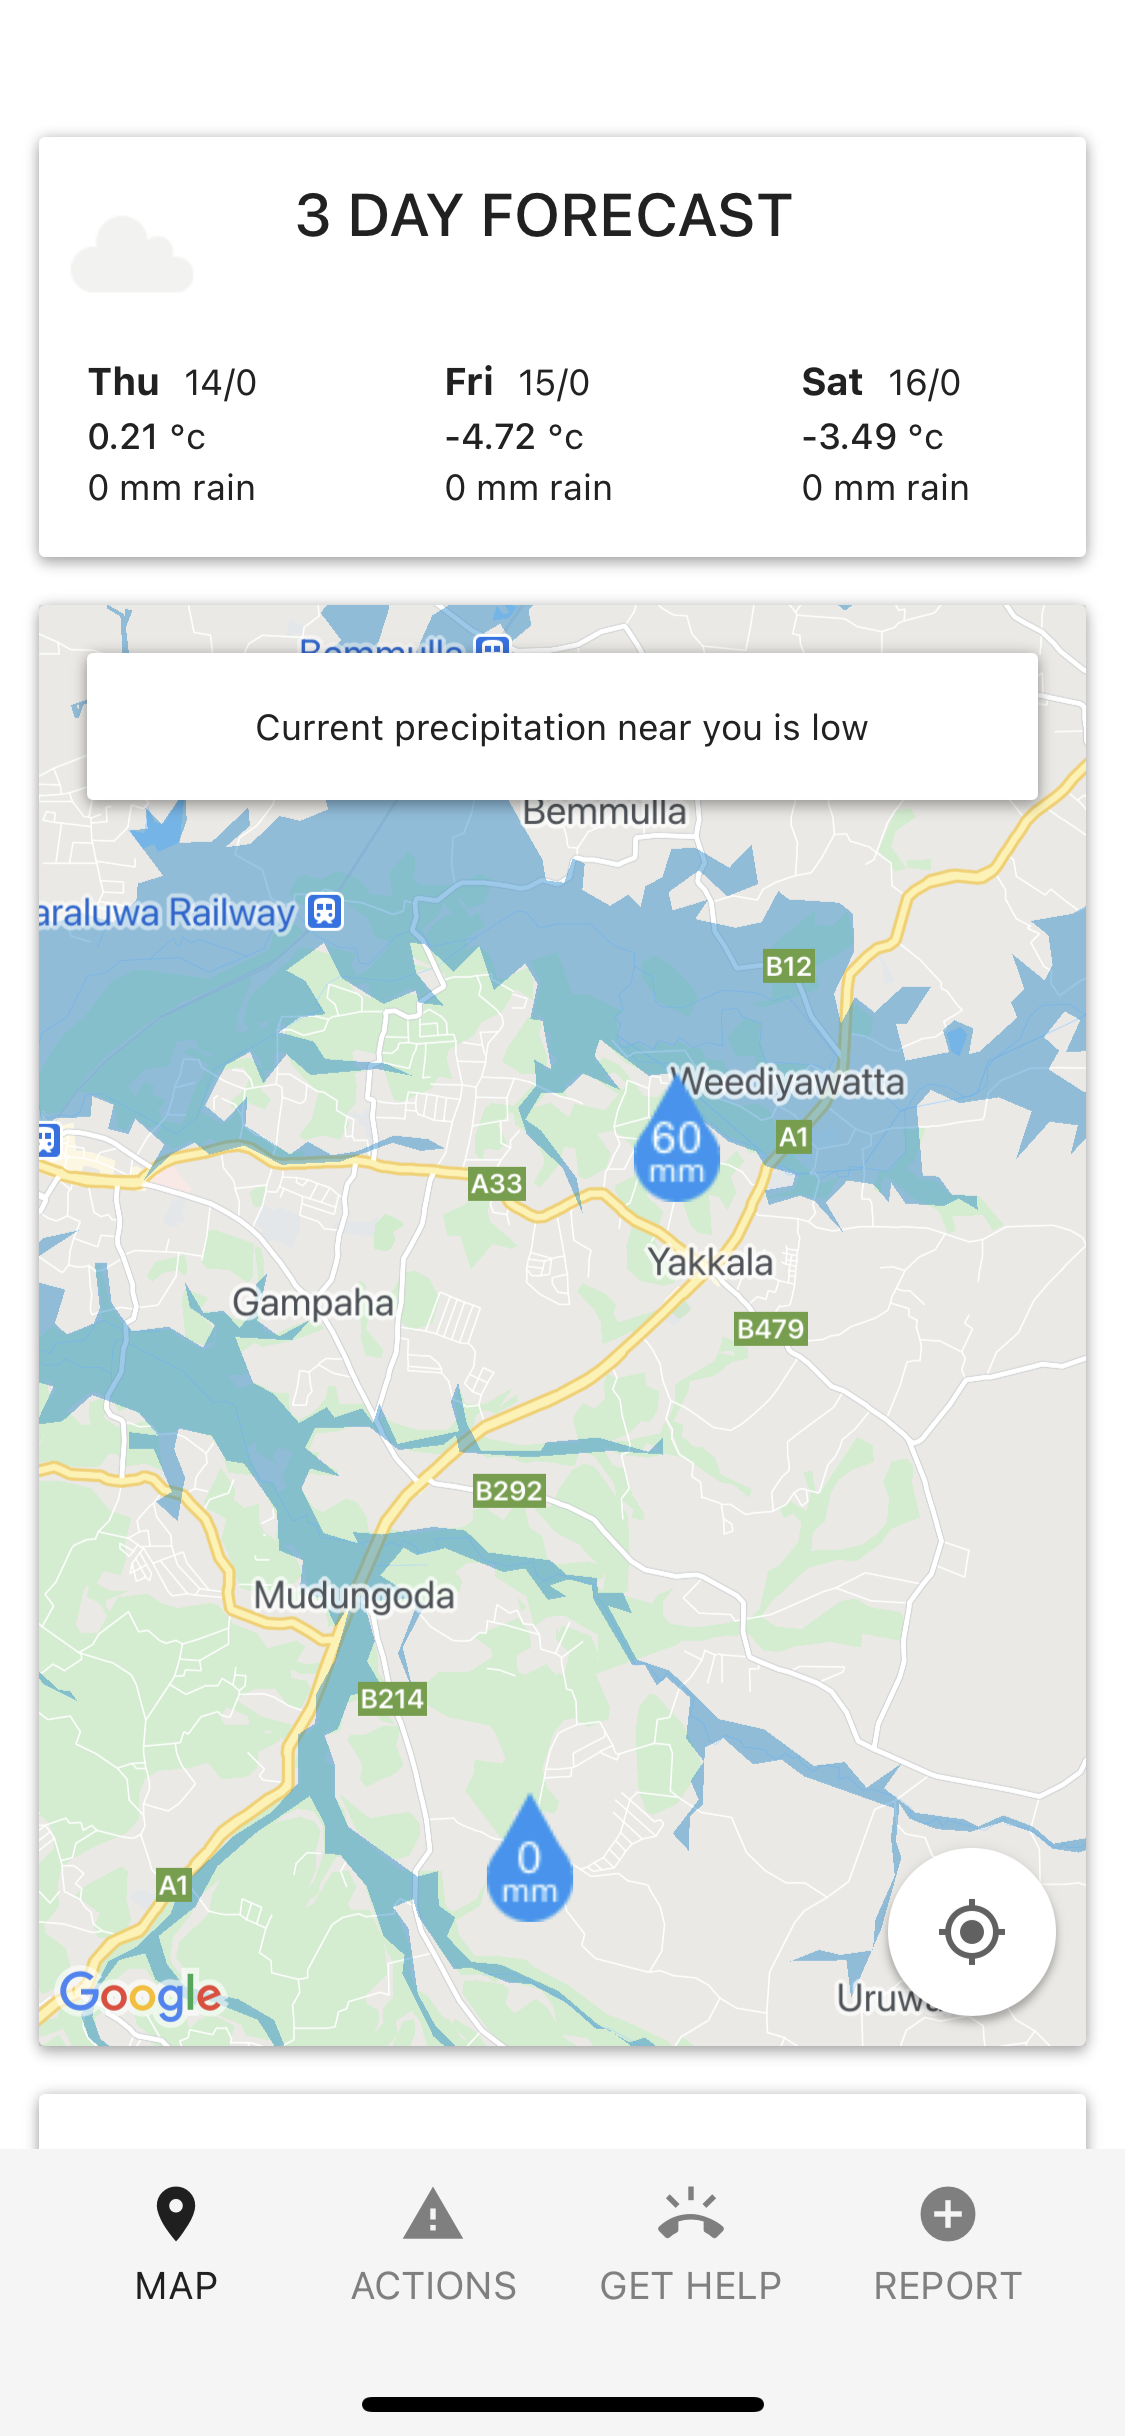
“Map” view showing the 3-day flood forecast (Thu–Sat temperatures and 0 mm rain) above a Google map centered on the user’s location in Copenhagen, with a “Current precipitation near you is low” alert banner.
Interaction Design: The Risk Assessment Engine
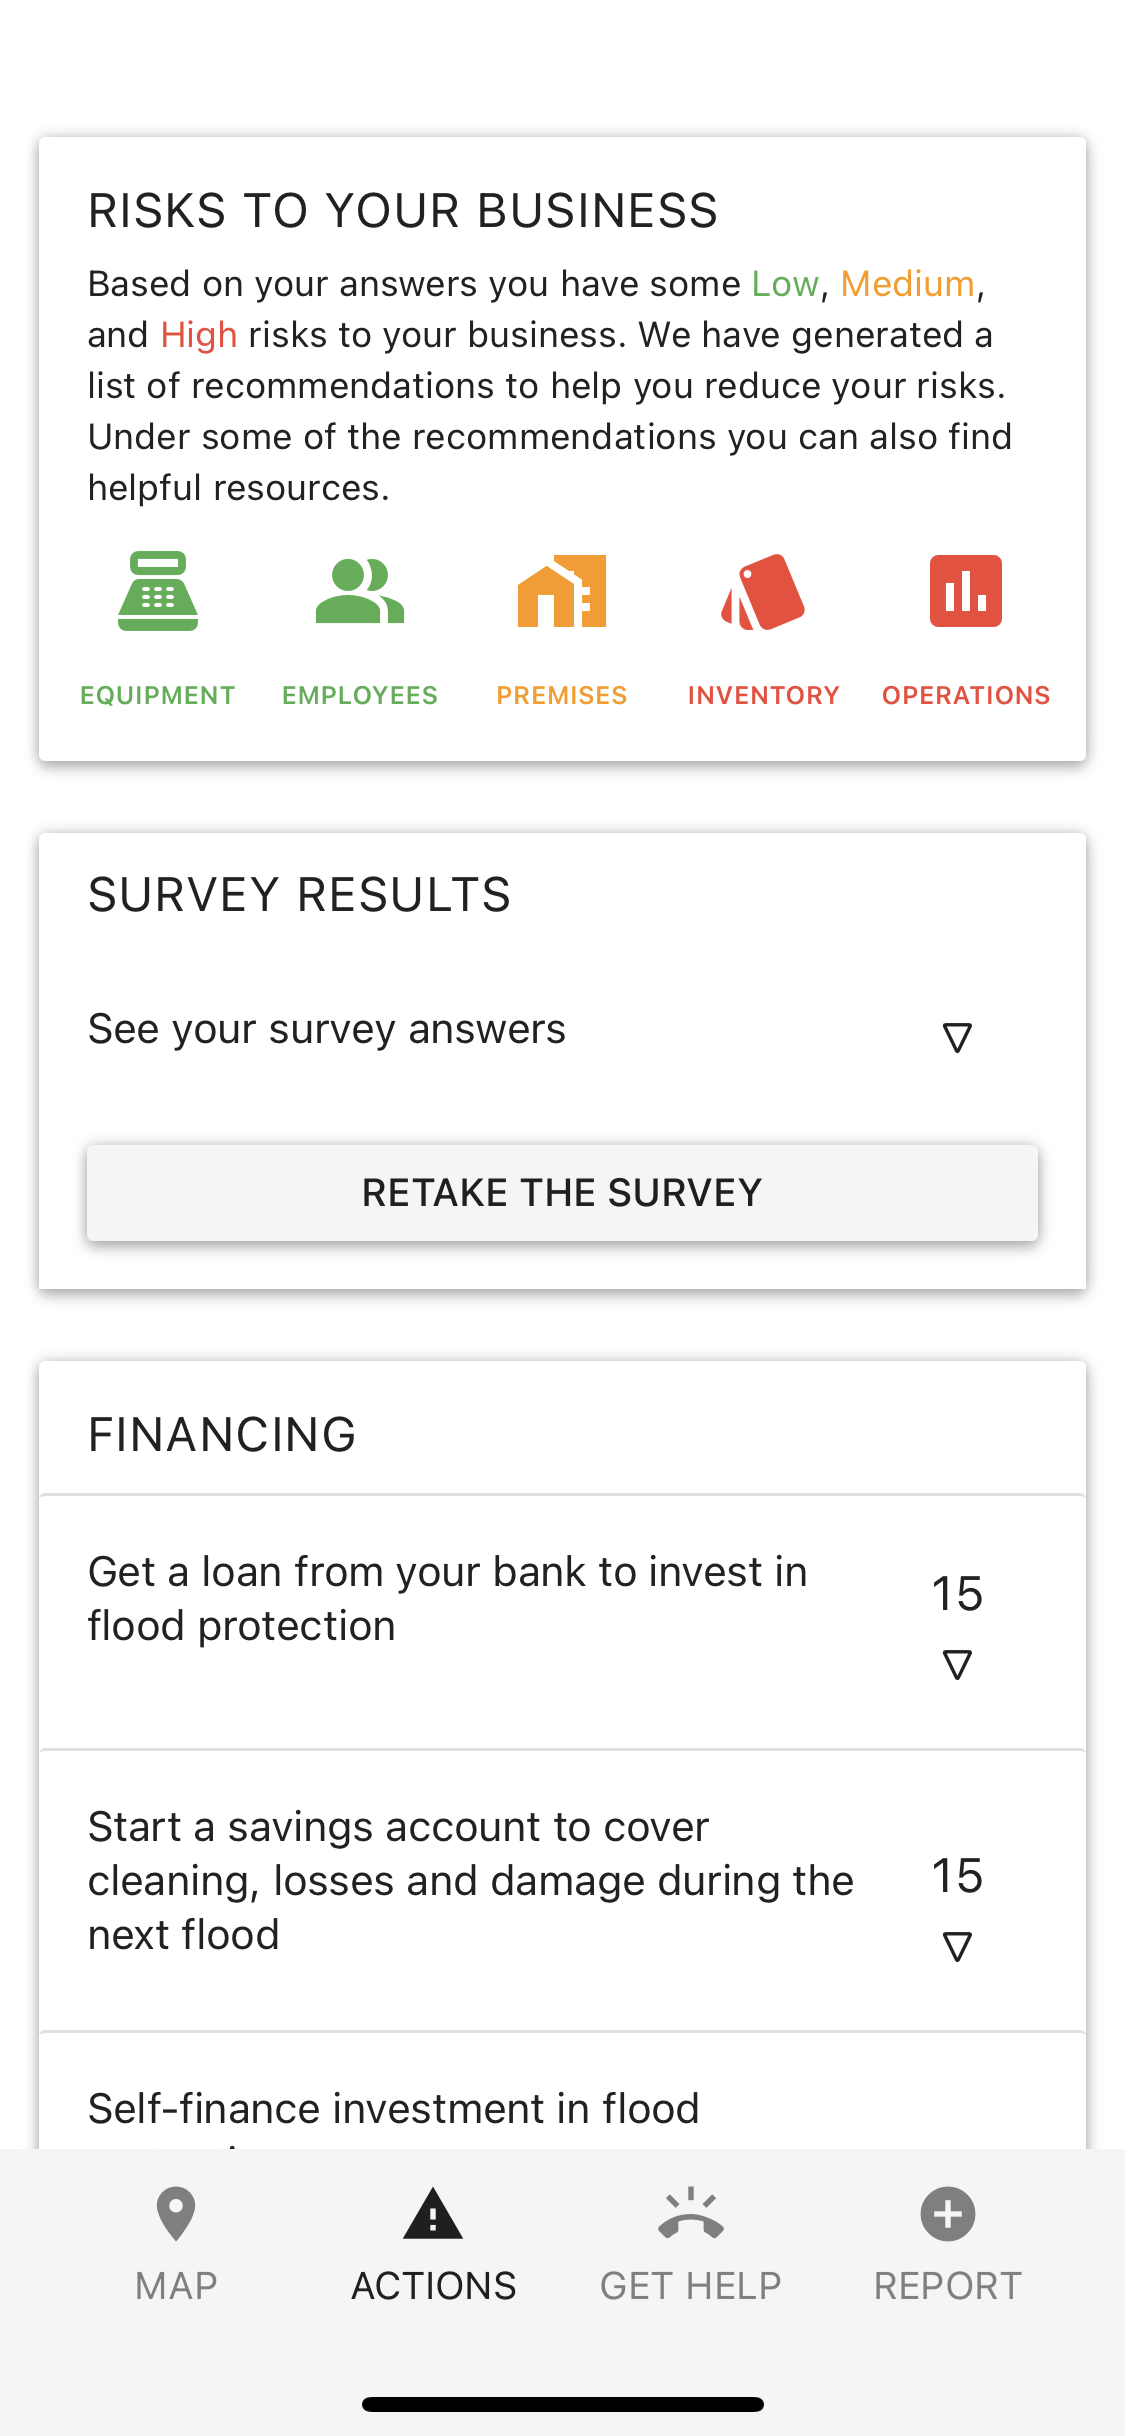
Traditional insurance forms are long and intimidating. I designed a lightweight, modular risk assessment that uses icon-based feedback to categorize risks into Equipment, Inventory, and Operations . This summary card provides instant value, offering personalized financing recommendations and prioritized recovery tasks based on the user's specific vulnerability profile.
“Risks to Your Business” summary card showing Low/Medium/High risk categories with corresponding icons for Equipment, Employees, Premises, Inventory, and Operations, plus collapsible Survey Results and financing recommendations.
Technical Product Management: Offline-First
In a disaster, connectivity is the first thing to go. I architected an "Offline-First" experience using SQLite for local storage. Users can log rainfall data or damage reports manually while offline ; the system automatically queues these for synchronization once a signal is found. This ensures the tool remains a reliable companion when it's needed most.
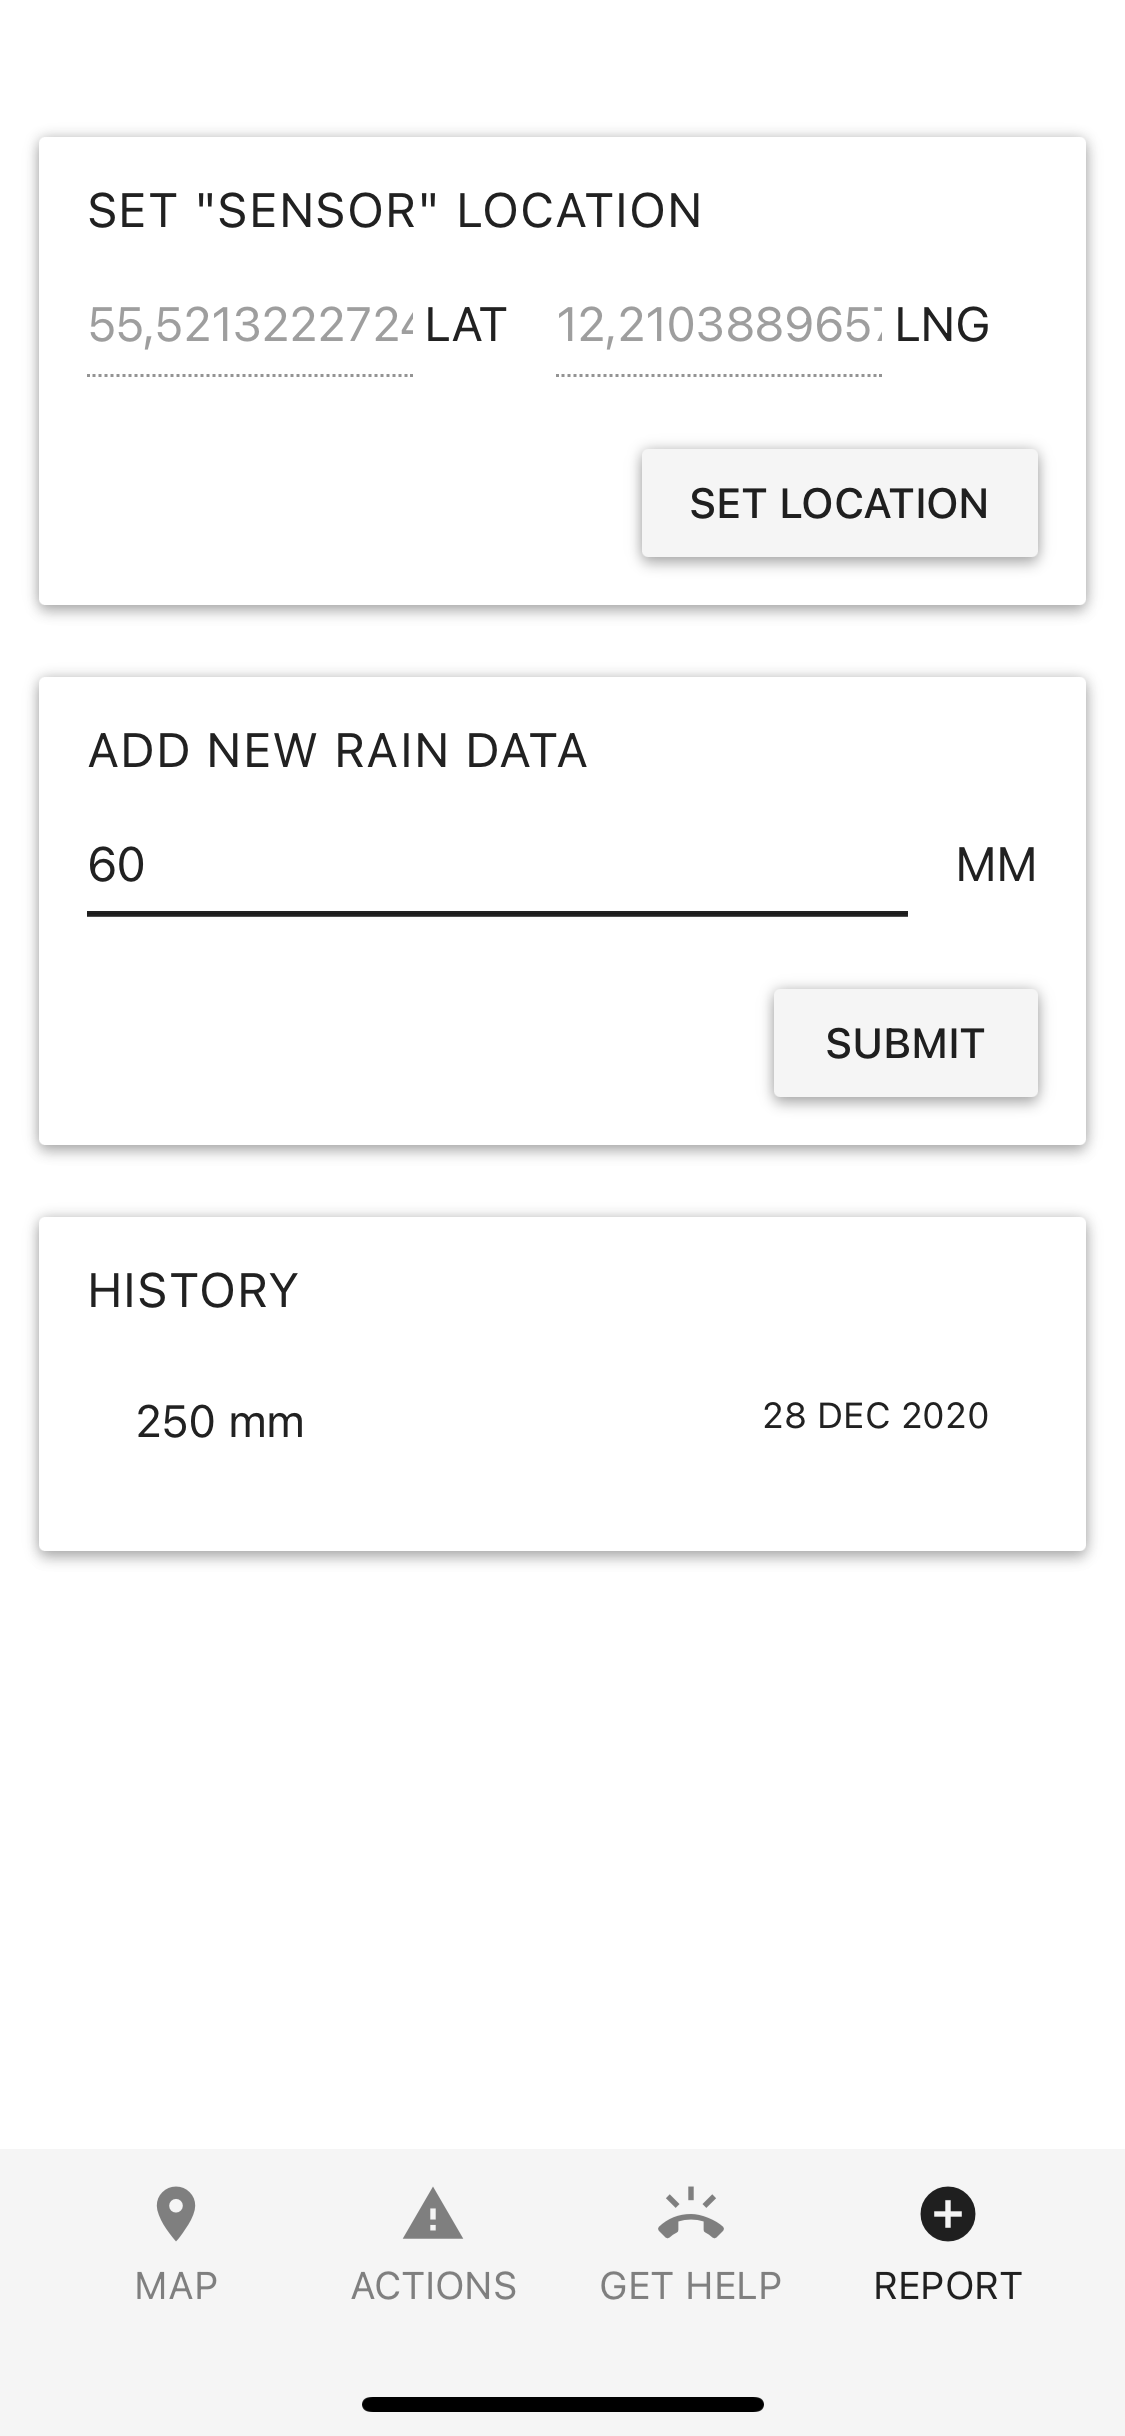
“Report” tab forms: a “Set ‘Sensor’ Location” card with latitude/longitude inputs and “Set Location” button, an “Add New Rain Data” card for submitting mm values, and a “History” card listing past entries (e.g. 250 mm on 28 Dec 2020).
Impact & Scalability
The pilot launched with 50+ SMEs and was presented at the Colombo Dissemination Forum in 2021. The success of the "Minimal Data Entry" approach led to interest from government ministries to scale the platform to Bangladesh and Myanmar. By focusing on visual language over heavy text, we created a tool that owners could master in under 10 minutes—even under the stress of an impending storm.
