NExTWORK: Public Innovation at Scale
A hybrid service-platform designed to re-engage vulnerable youth through network-driven employment.
Client
ROCKWOOL Foundation
Year
2017–2022
Role
Project Manager & Service Designer
The Challenge: Breaking the Welfare Loop
In Denmark, thousands of young adults remain stuck in passive welfare cycles. The ROCKWOOL Foundation identified that the root cause wasn't just a lack of jobs, but a lack of professional networks. My role was to lead the design and management of NExTWORK—a platform that shifts the focus from "CV workshops" to relationship-building and data-informed peer support.
Service Strategy: Trust Before Automation
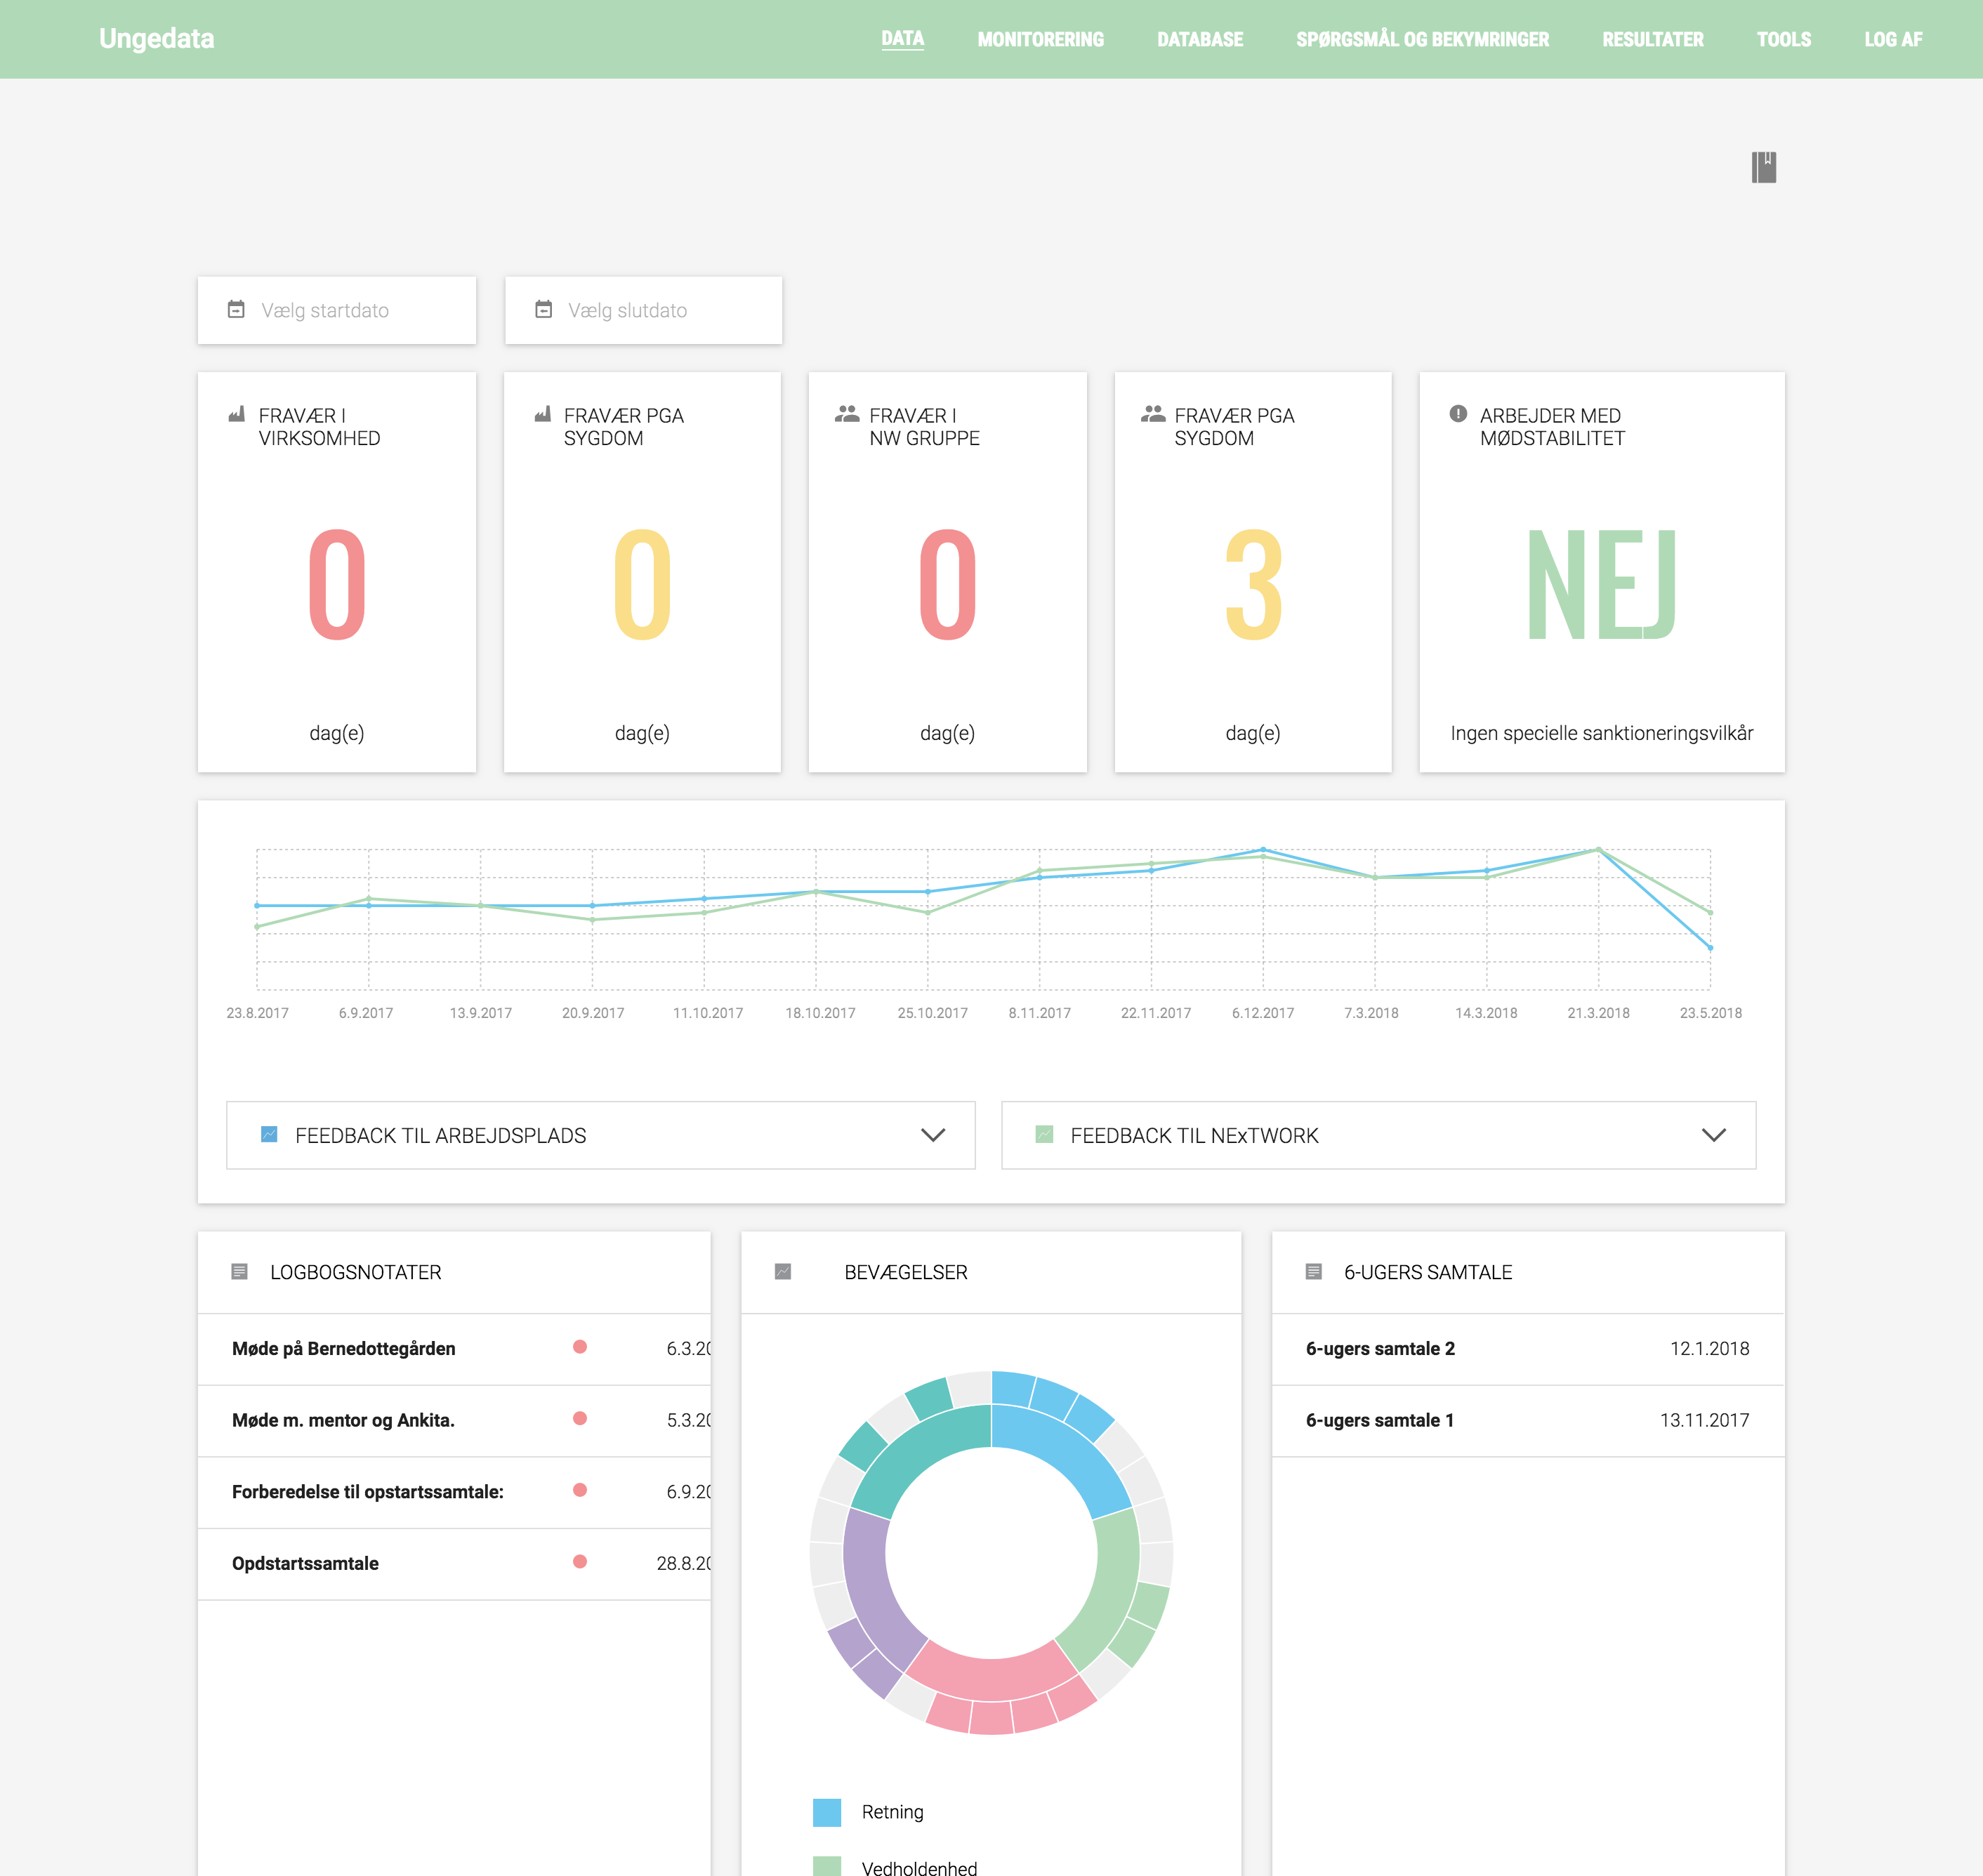
The core of the product is a "blended" model. I designed the interaction flows between youth, municipal coaches, and SMEs. A key visual proof of this is the "Movement Donut" —a proprietary tracking system I designed to measure "soft" progress like curiosity and resilience, giving coaches a scientific way to track qualitative human growth .
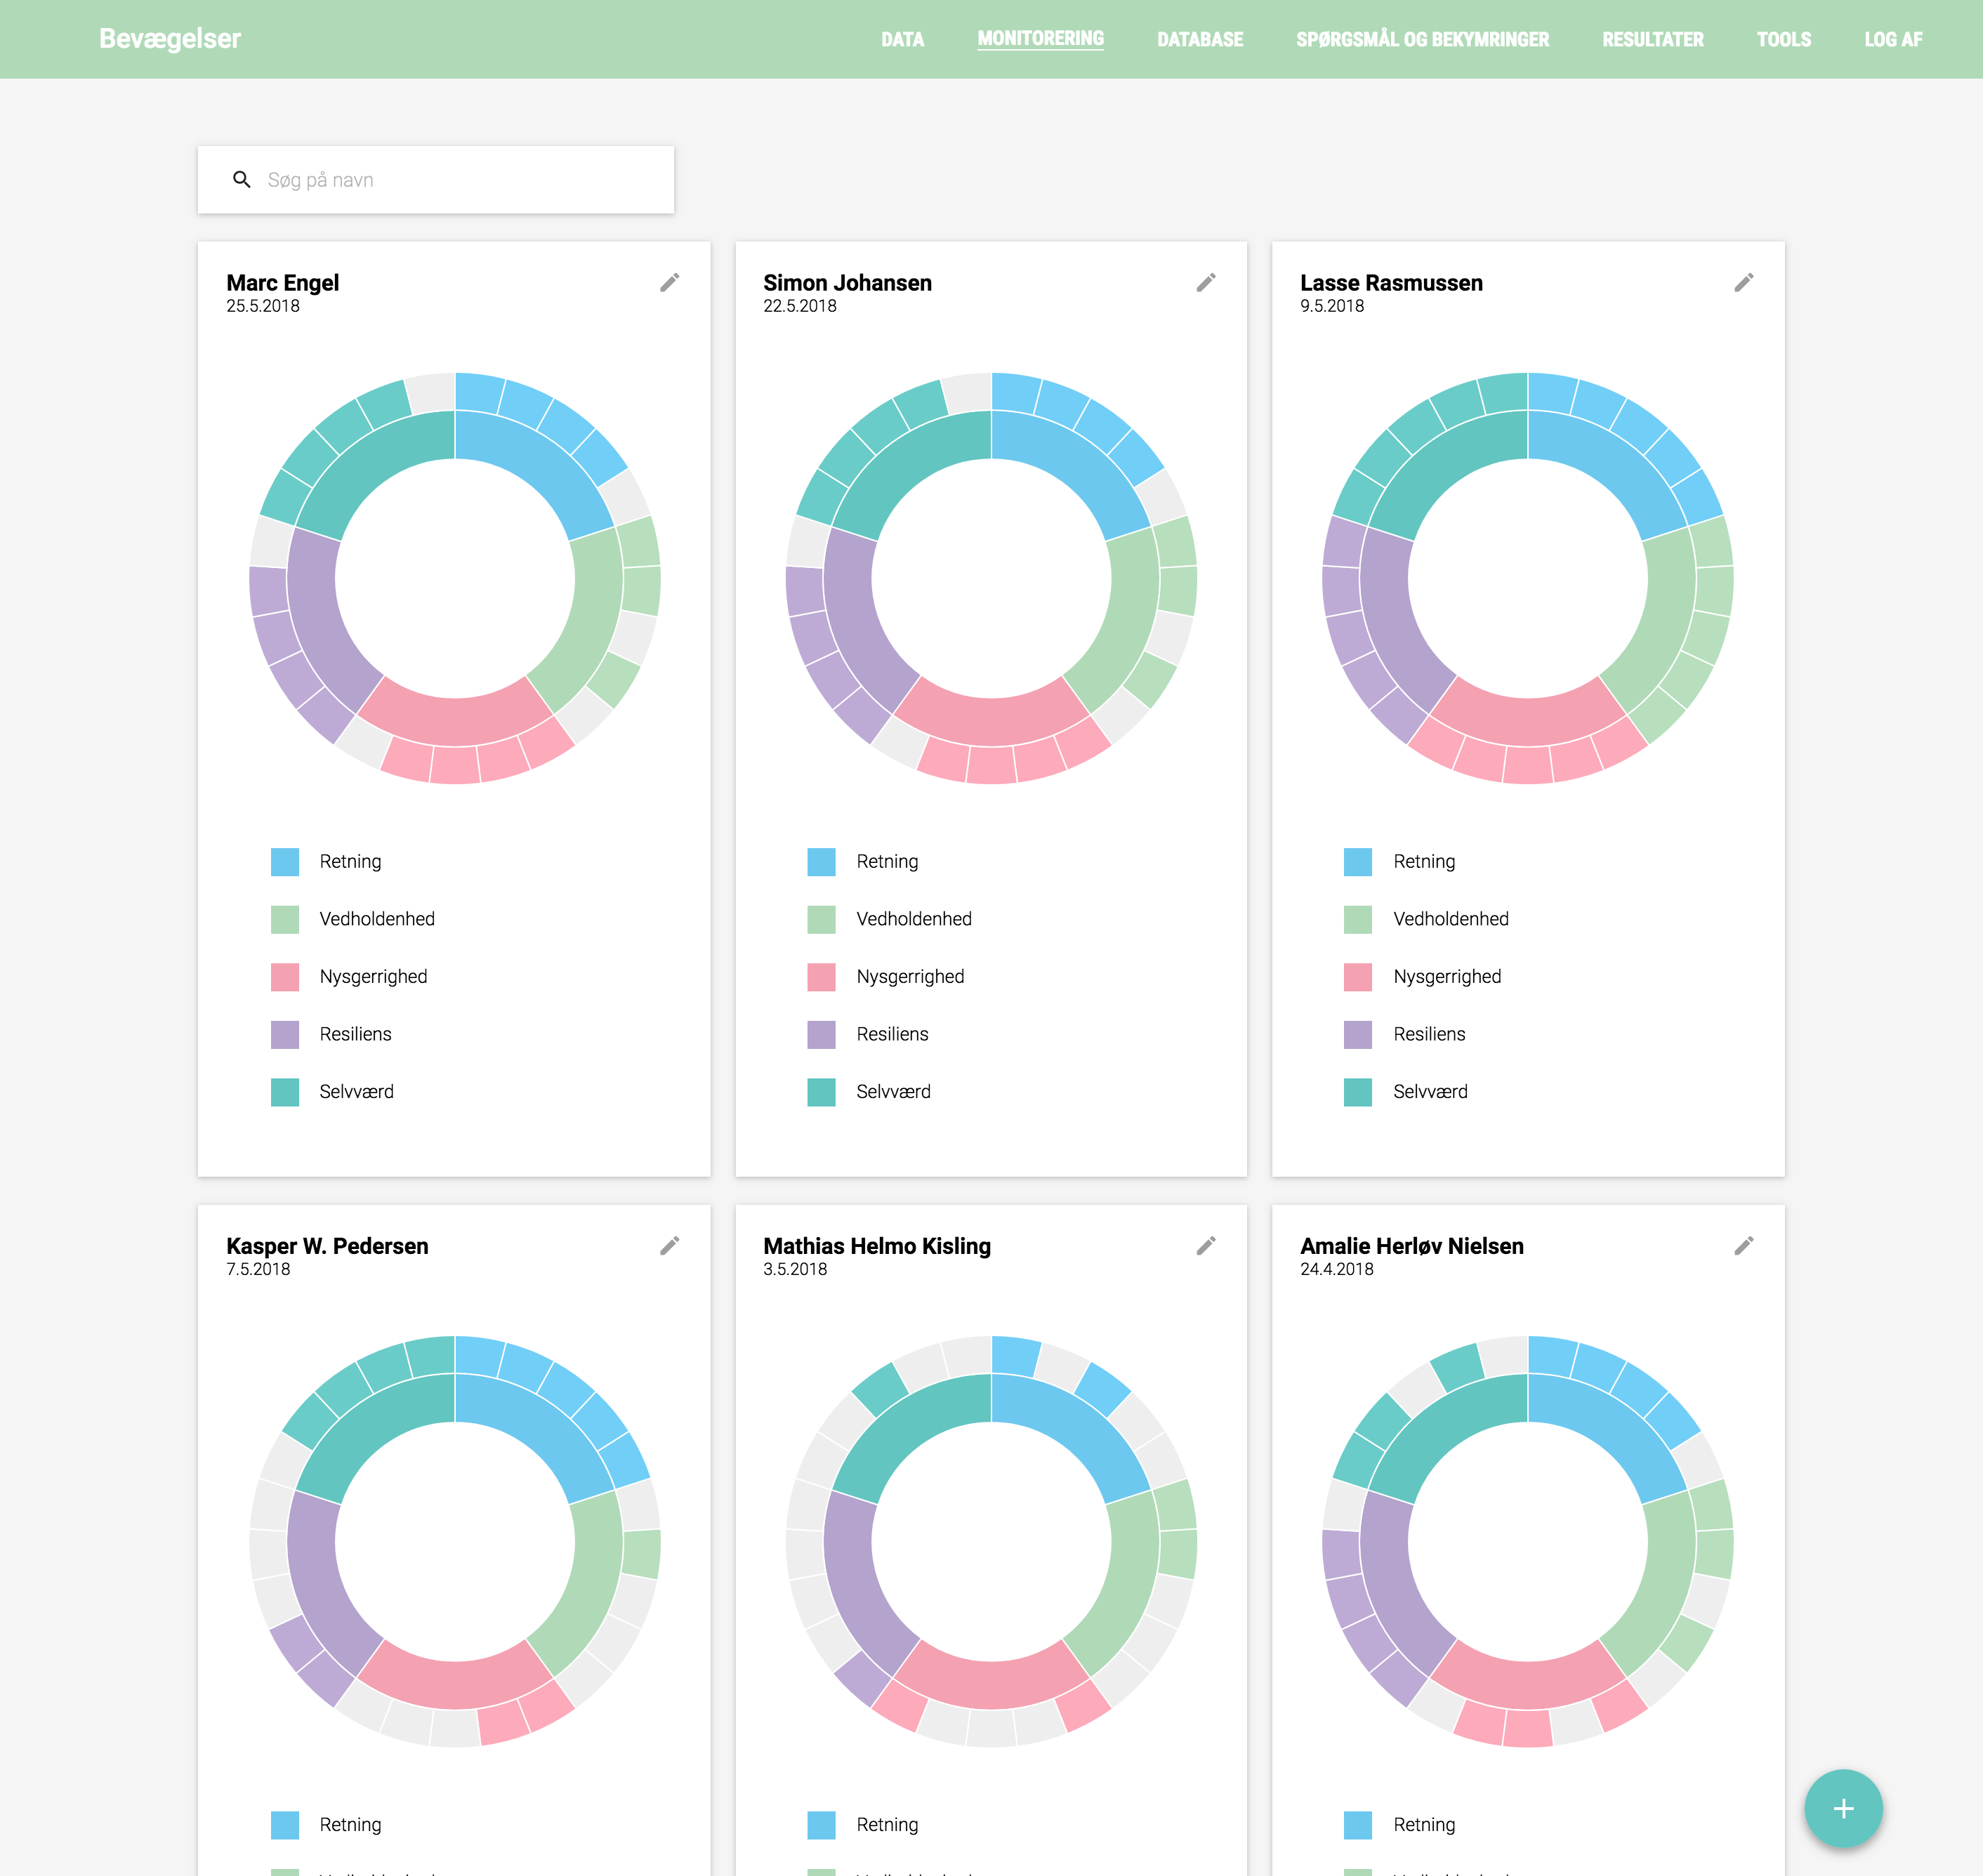
“Bevægelser” monitoring screen showing a search bar and a grid of individual “movement” donuts for participants (Marc Engel, Simon Johansen, Lasse Rasmussen, etc.), each donut layer encoding “Retning,” “Vedholdenhed,” “Nysgerrighed,” “Resiliens,” and “Selvværd.”
Designing for Multi-Stakeholder Complexity
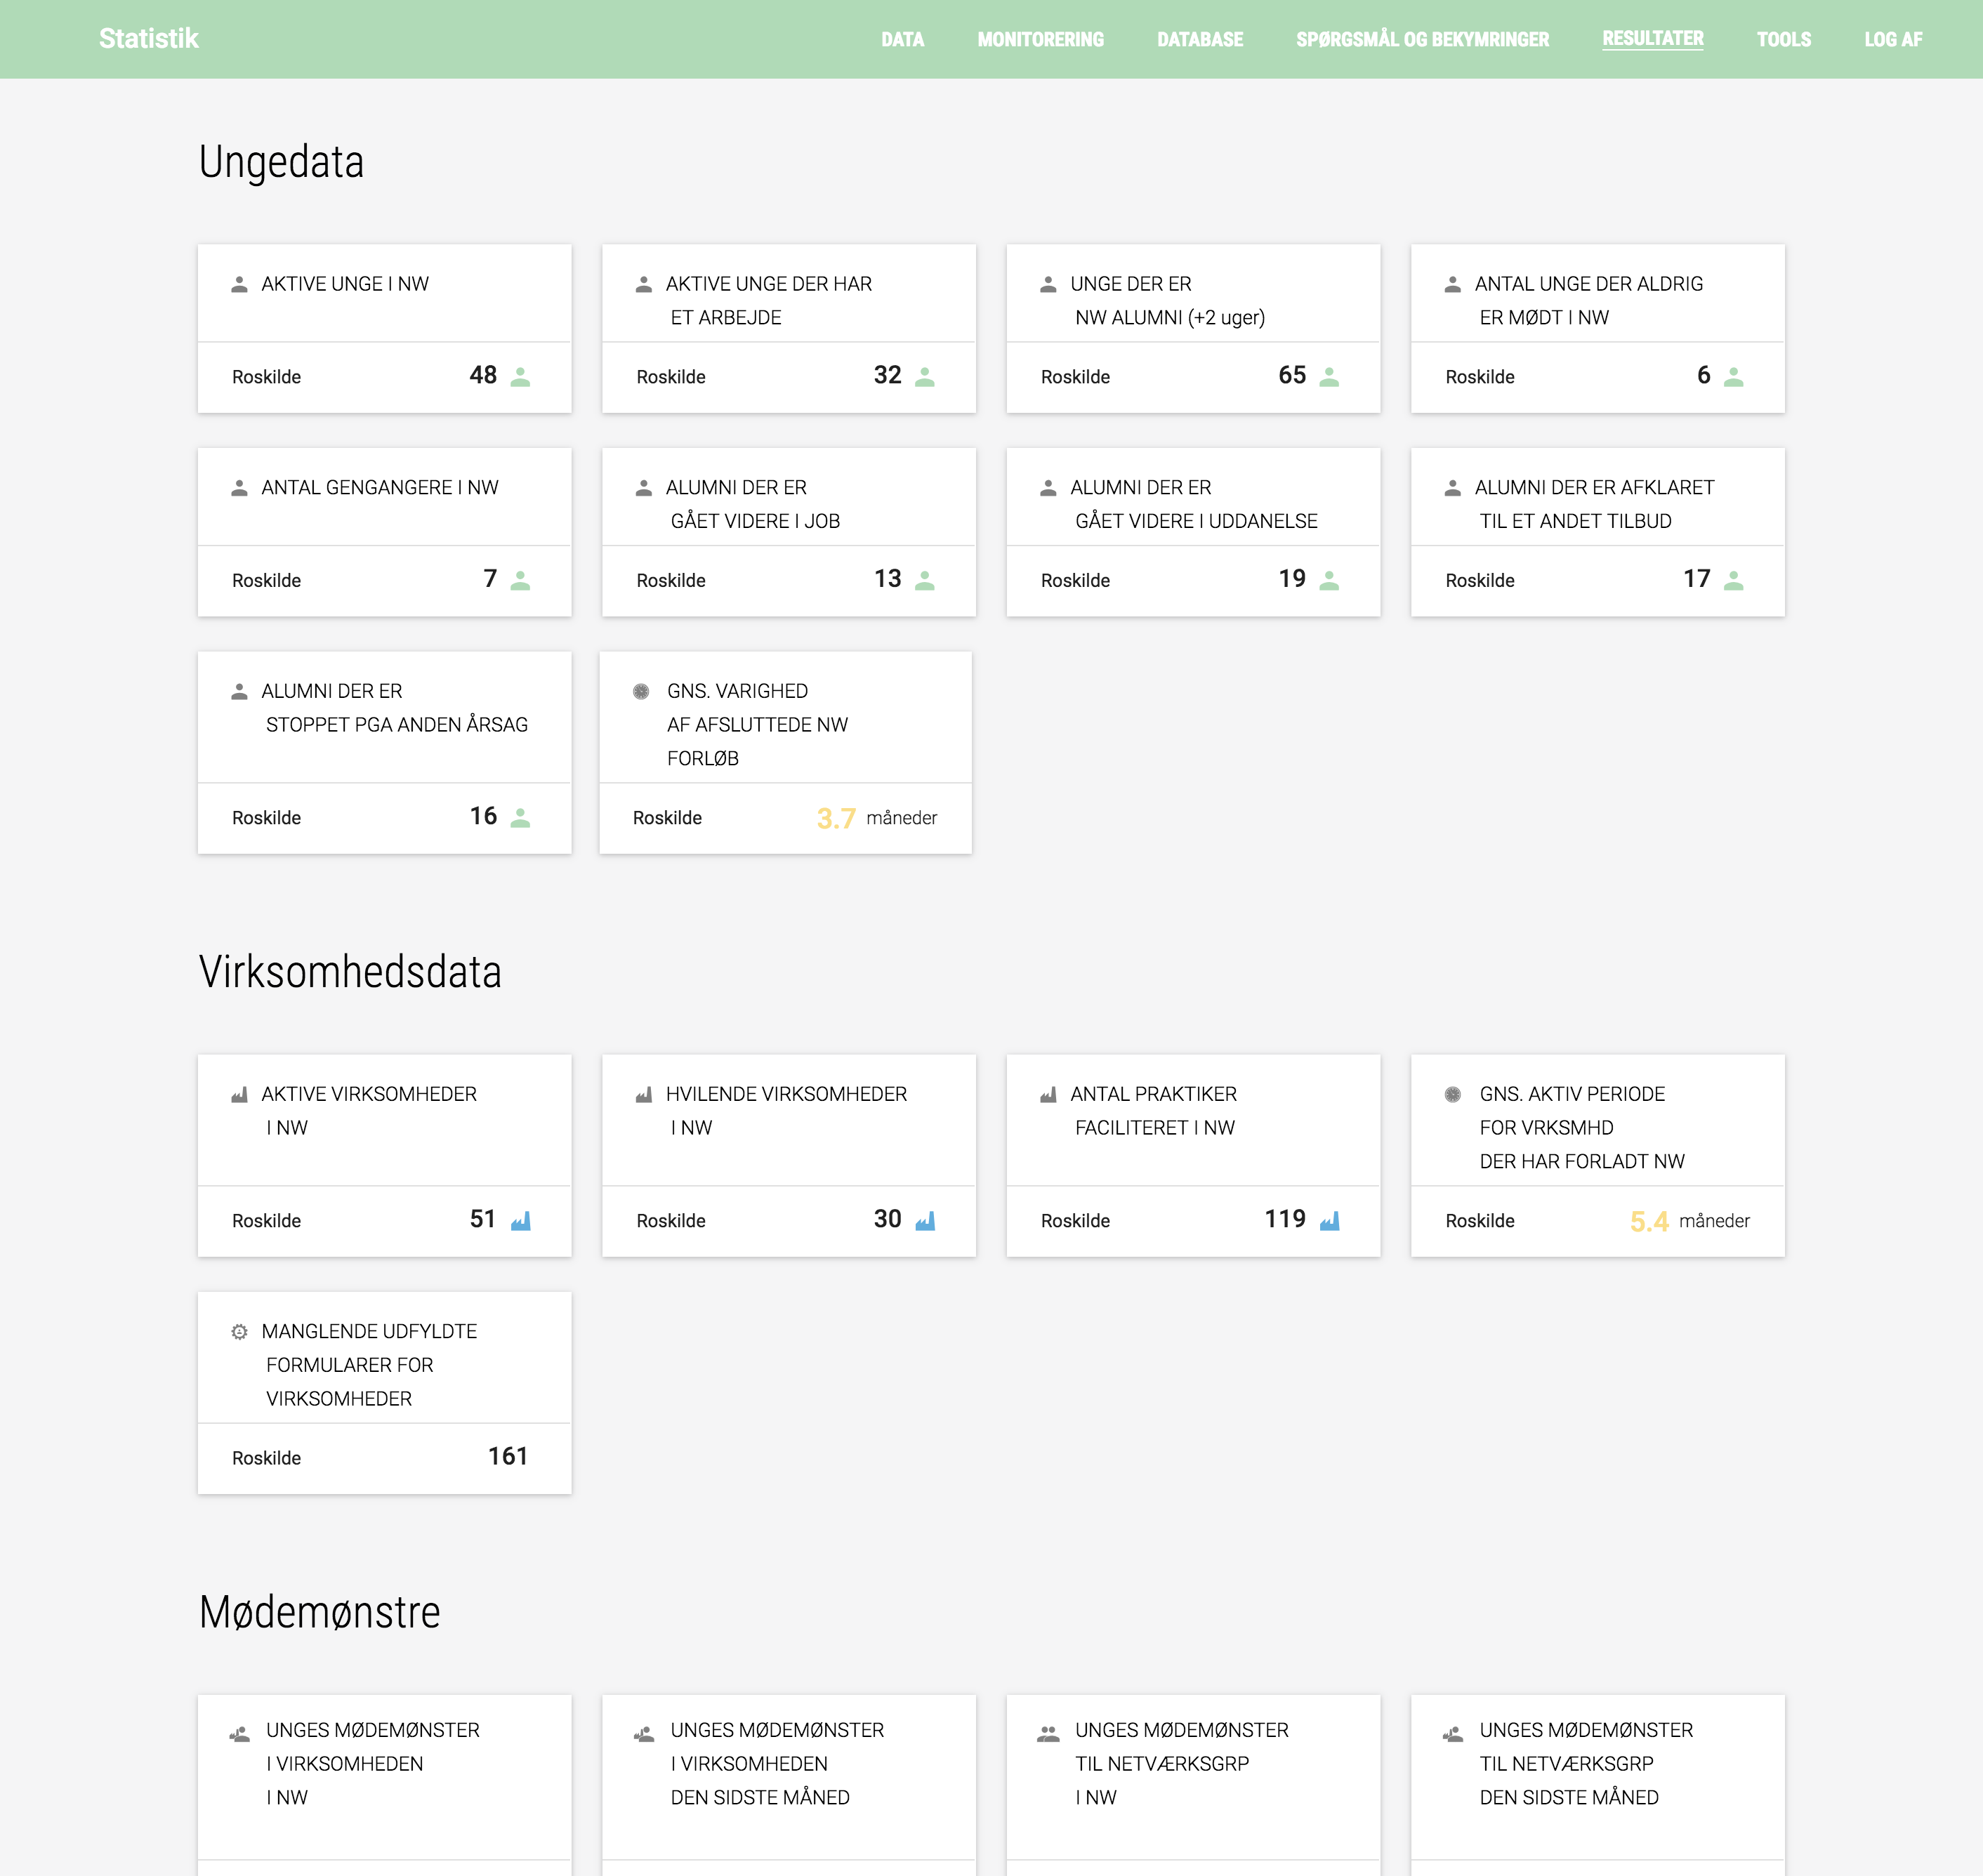
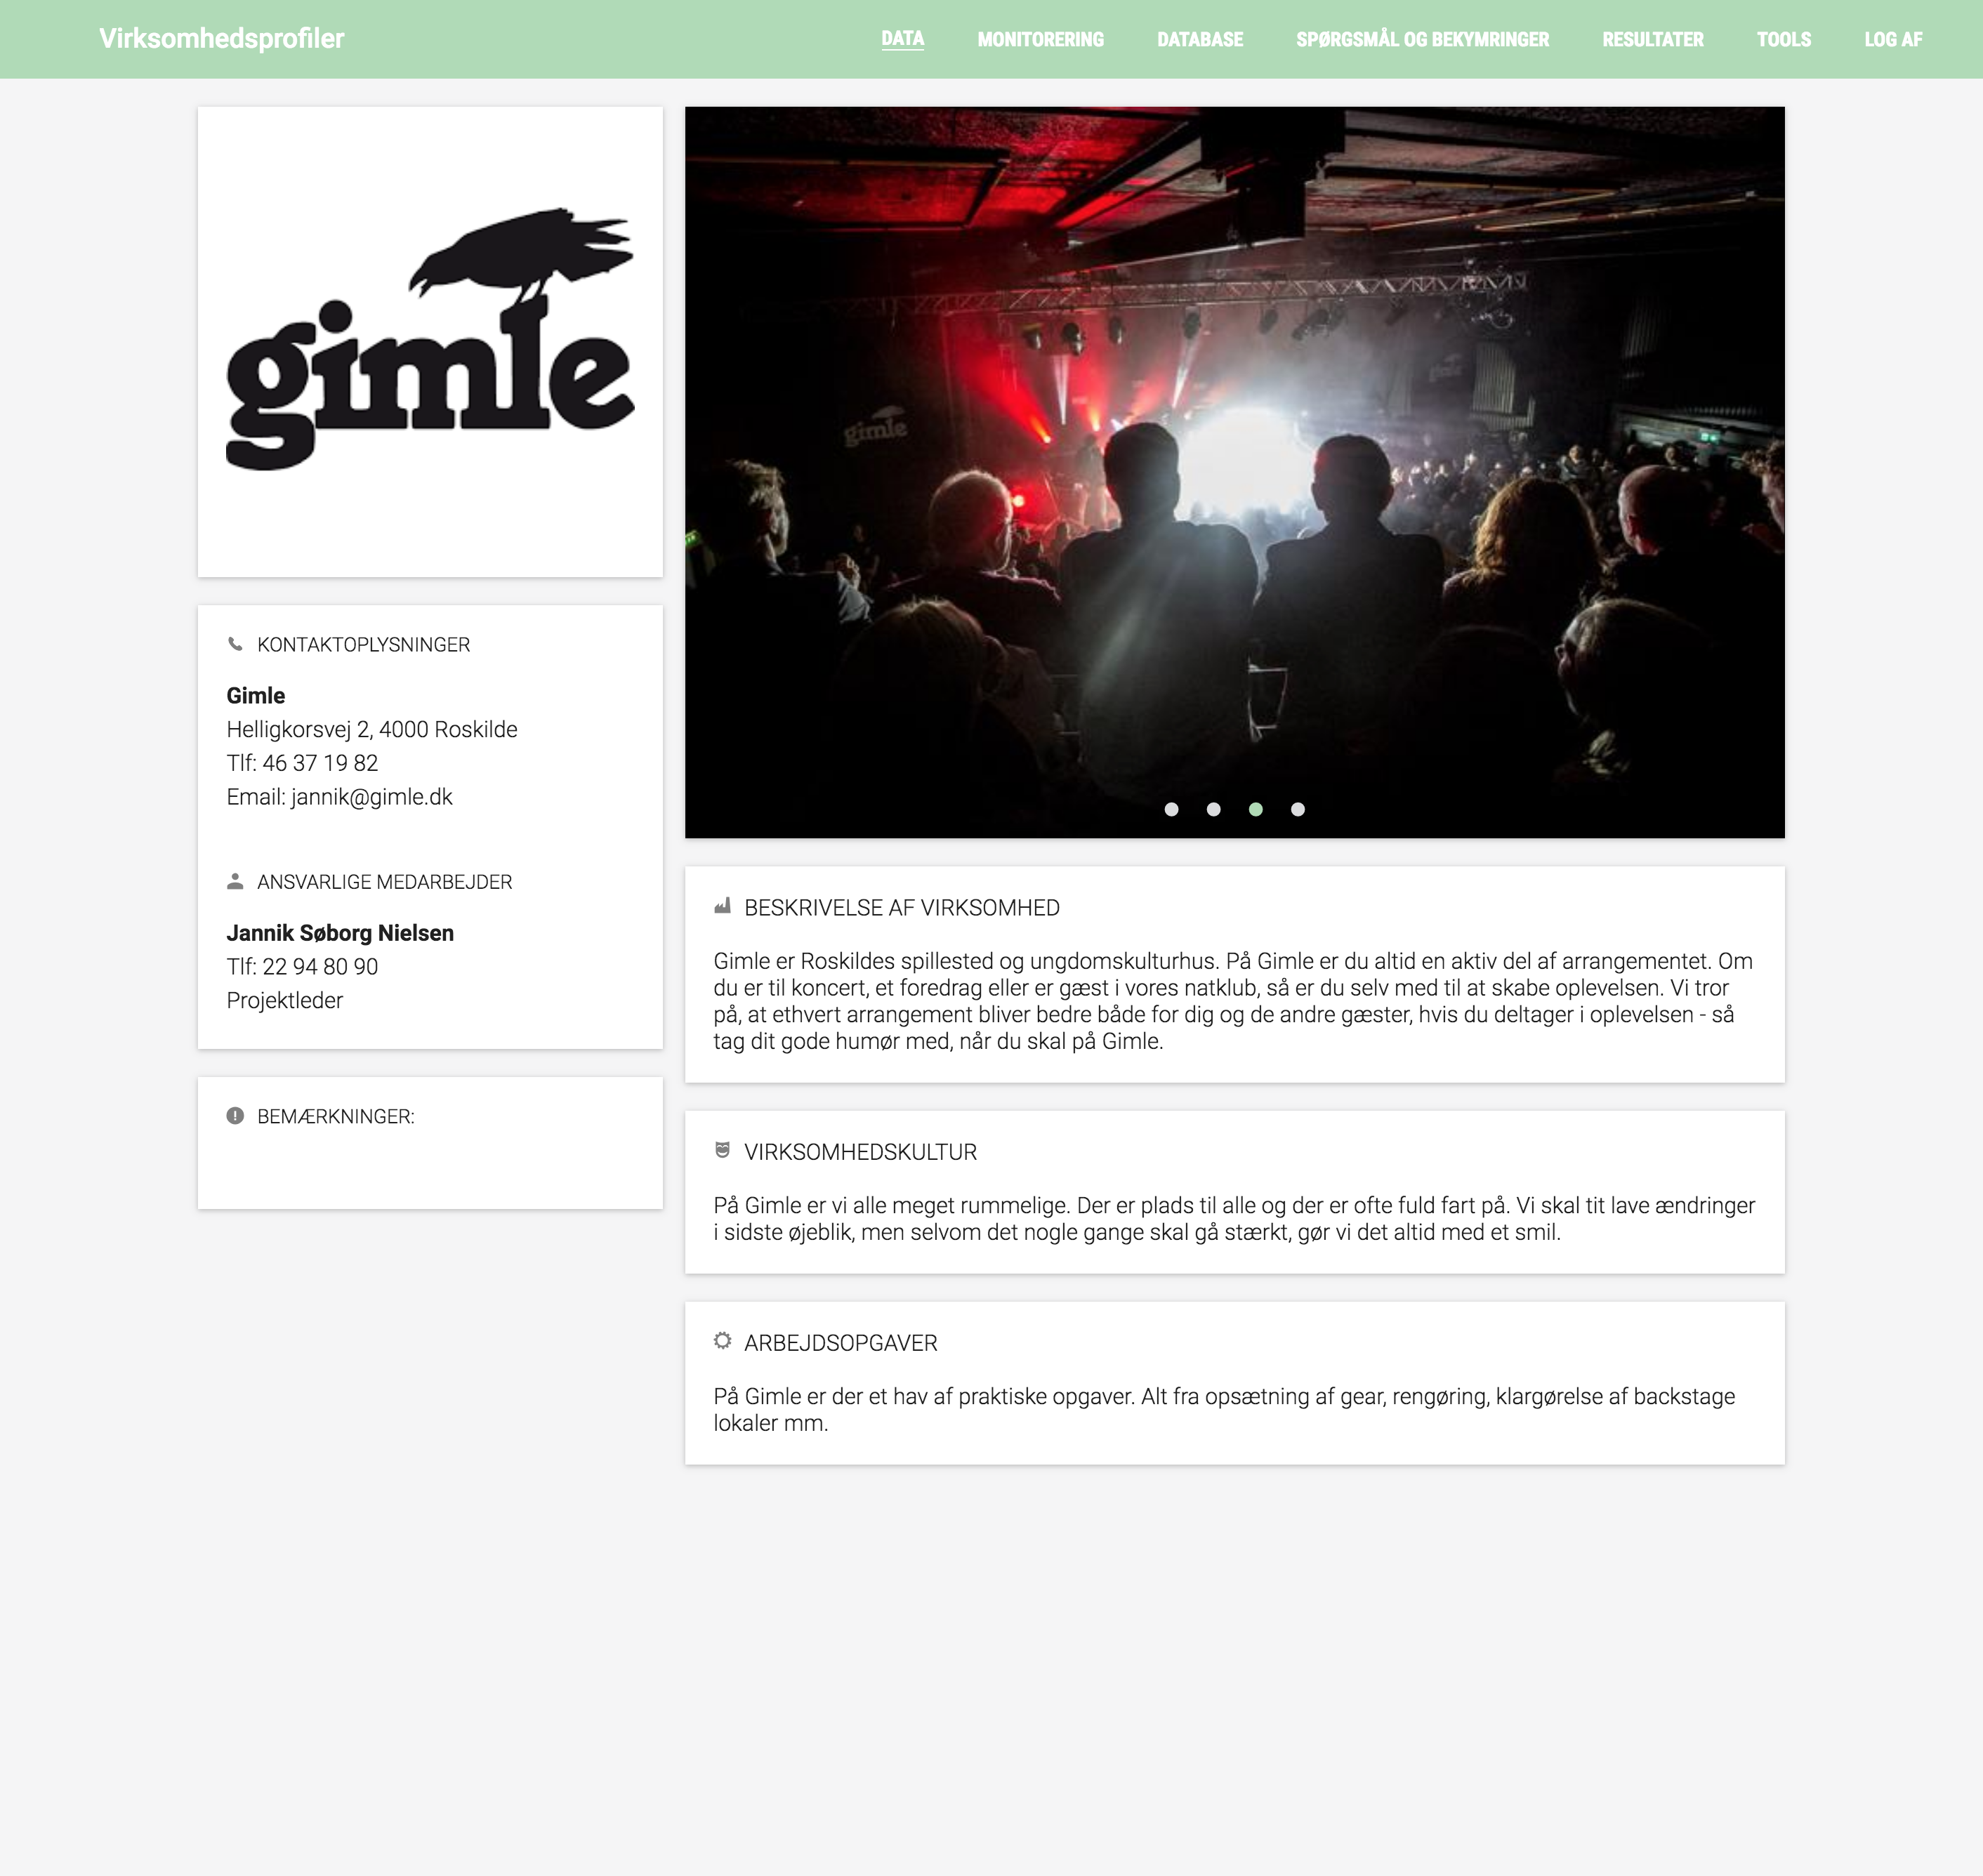
I architected a tripartite dashboard ecosystem. For youth, the focus was on low-friction feedback and stability tracking . For municipal caseworkers, I designed a high-level "Statistics" suite to monitor DKK 15 billion in systemic spend across five cities . For SMEs, I created rich profile modules that allow businesses to showcase their company culture and social mission to prospective interns .
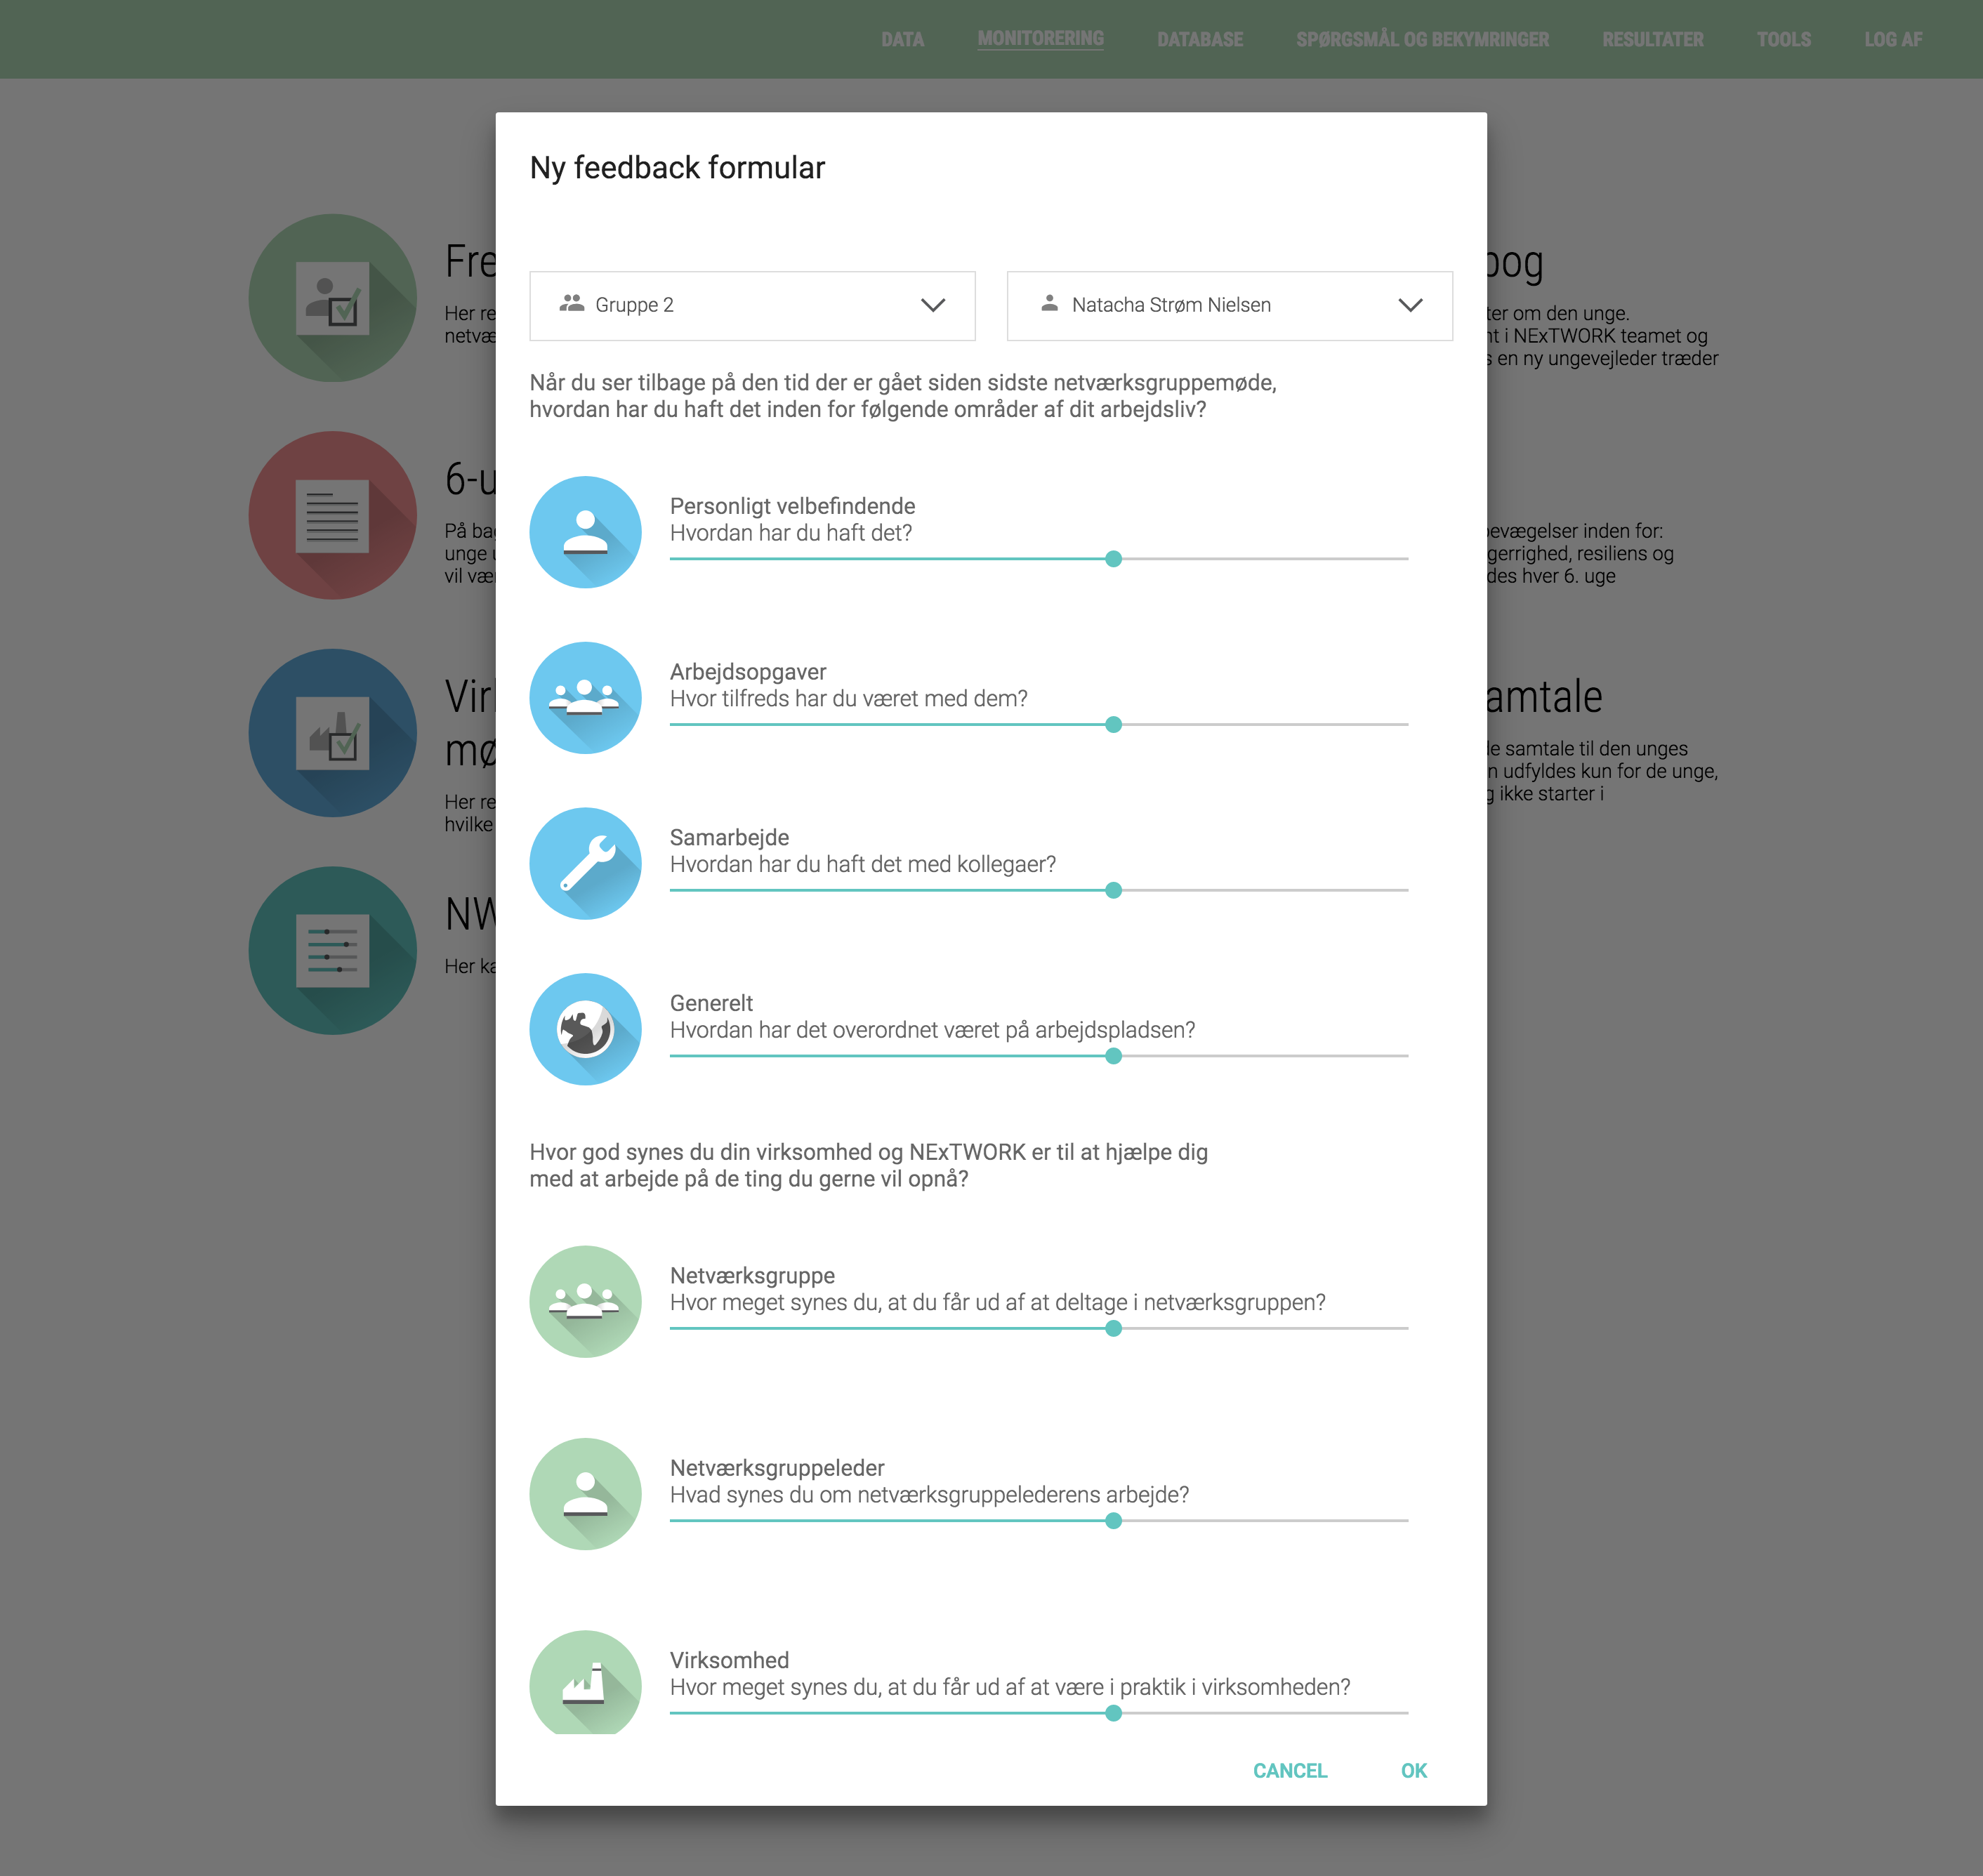
“Ny feedback formular” modal overlay (TOOLS tab) with dropdowns for group and coach, followed by sliders for “Personligt velbefindende,” “Arbejdsopgaver,” “Samarbejde,” “Generelt,” and more questions about network-group and company experience.
UX Challenge: Translating Fieldwork into Digital
Public sector tools often suffer from bloated UI. I led co-creation workshops with over 200 youth and SME participants to ensure our digital components mirrored real-world needs. This led to an "editable database" architecture that allows caseworkers to manage complex human networks with the ease of a modern SaaS tool, reducing administrative time by 20%.
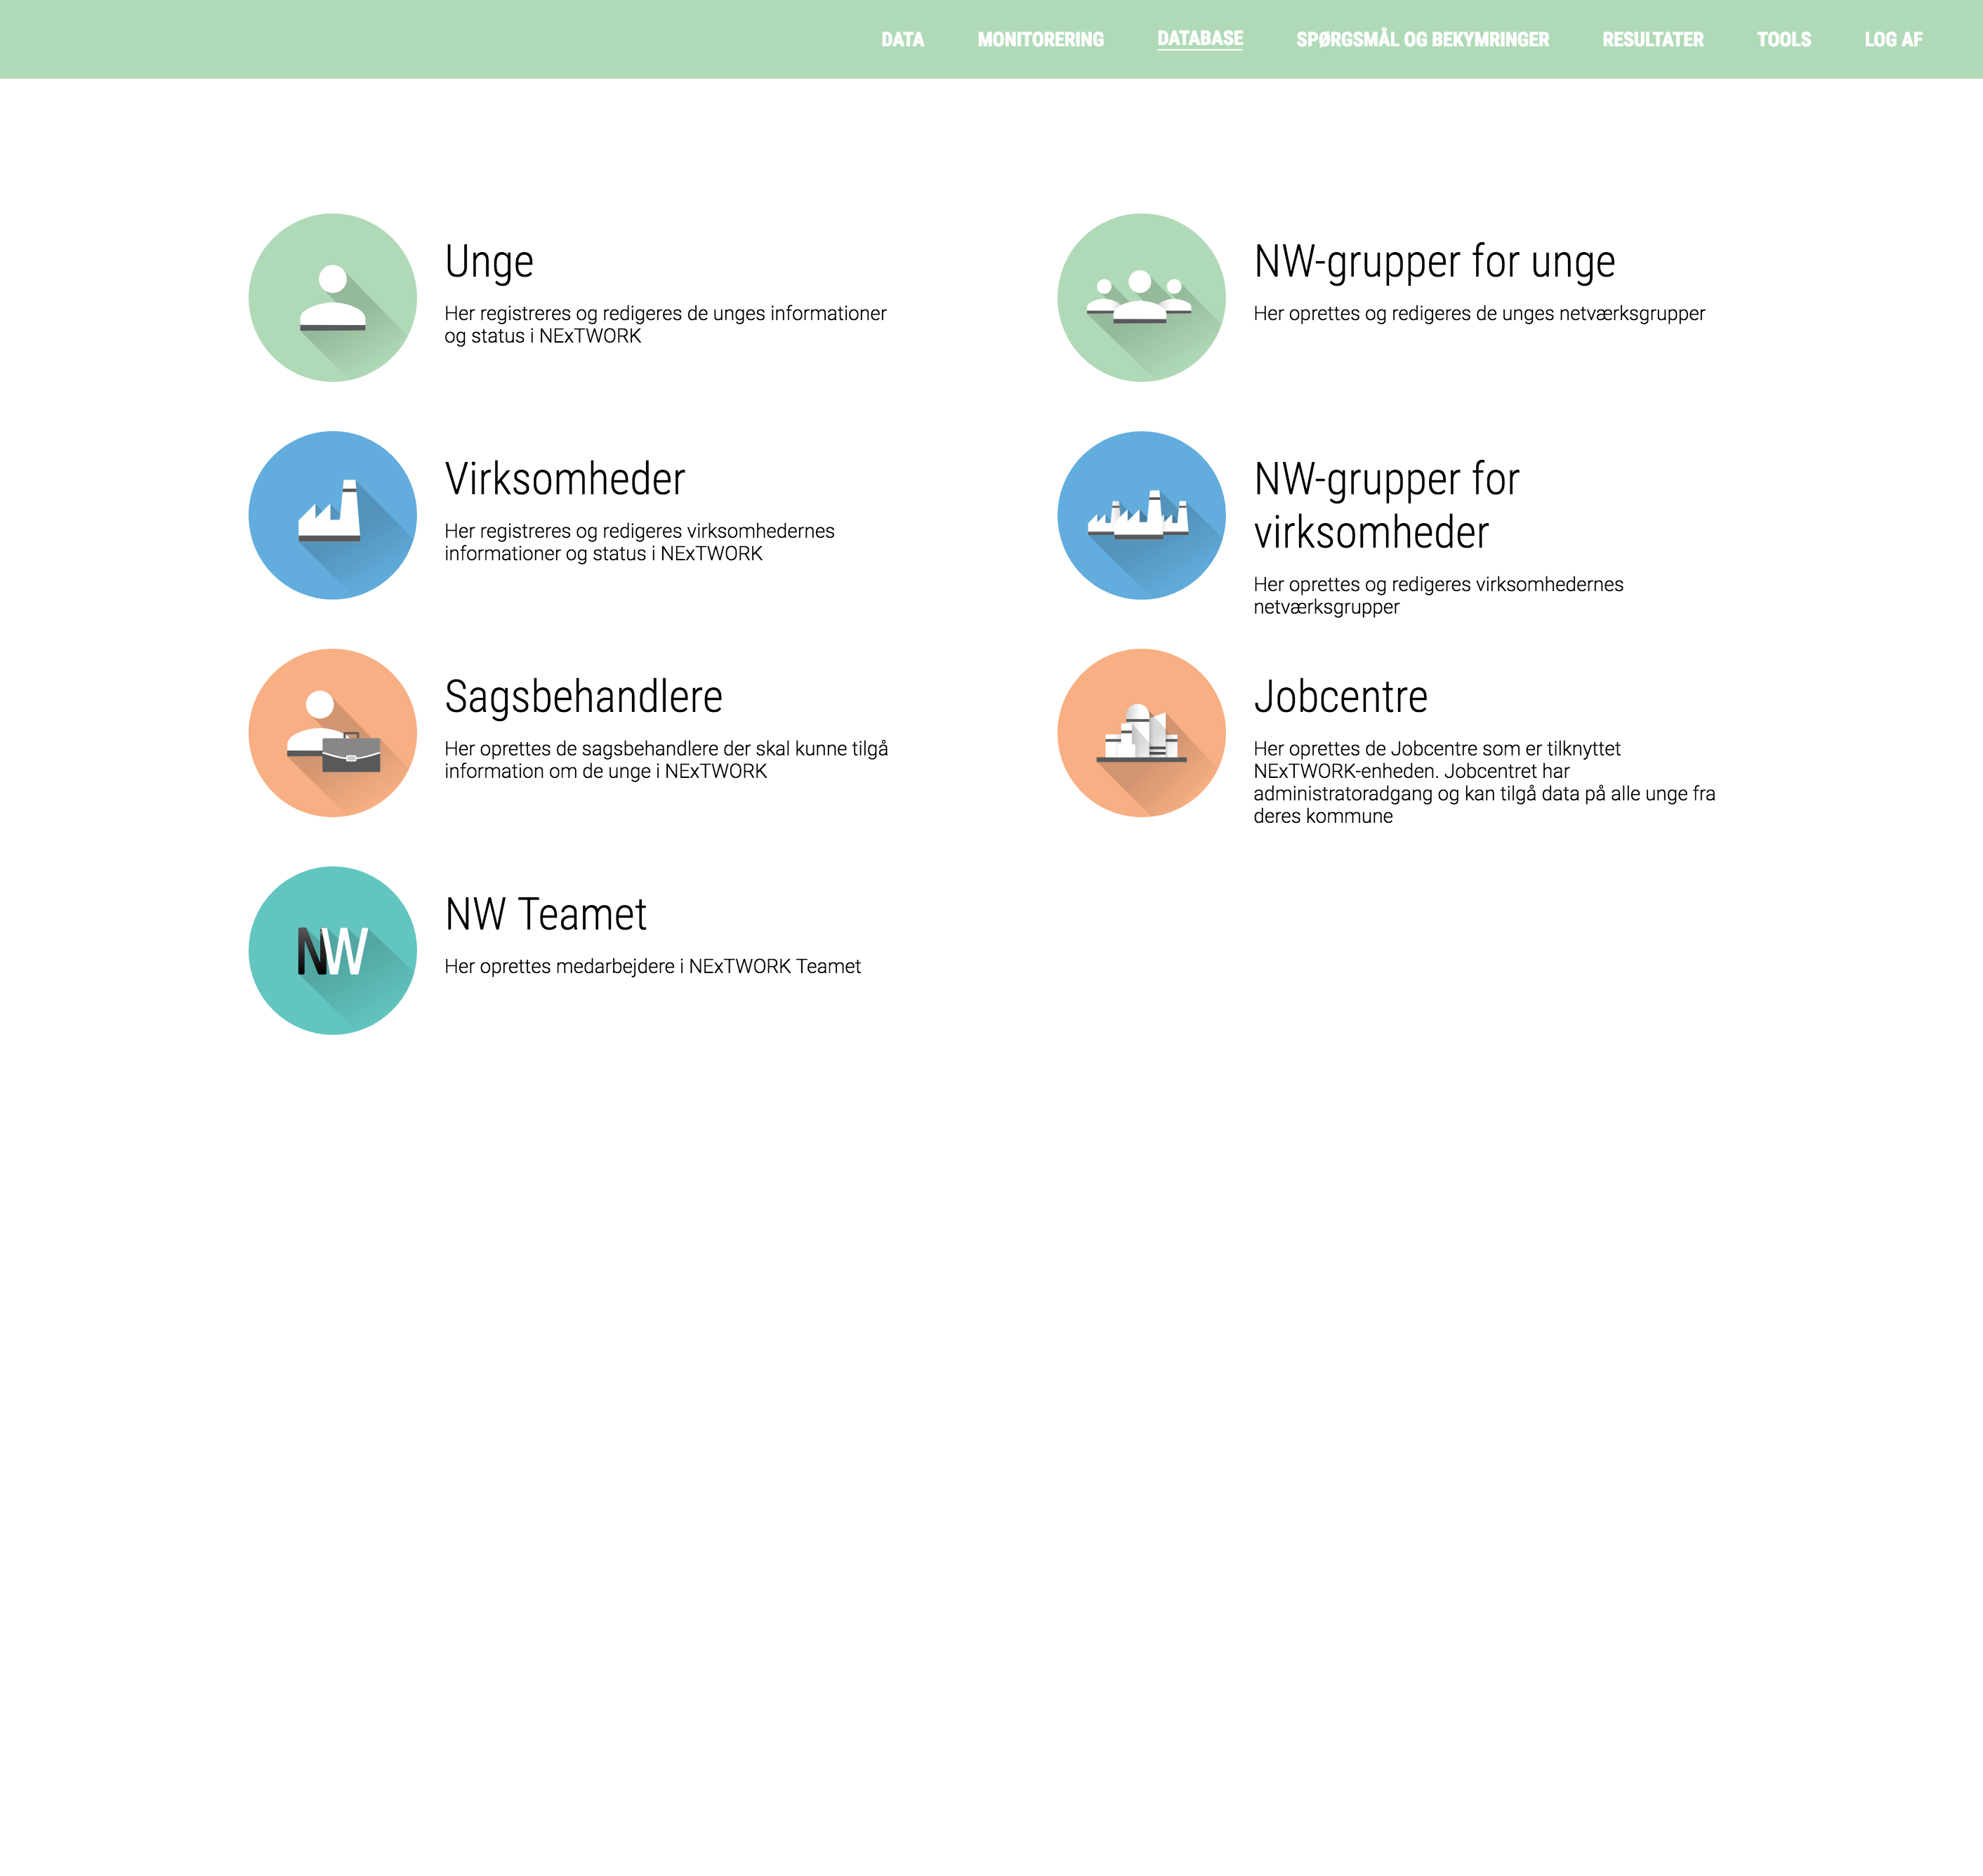
“Database” screen listing editable categories: Unge (youth), Virksomheder (companies), Sagsbehandlere (caseworkers), NW Teamet, NW-grupper for unge, NW-grupper for virksomheder, and Jobcentre, each with icon and explanatory text.
The Pivot: From Matching to Relationship Building
We initially assumed a digital job-matching algorithm would suffice. However, early field testing showed that youth needed "social chemistry" before technical matching. As Project Manager, I led a pivot toward a facilitator-led model supported by digital feedback loops. This ensured that every "Match" was based on a human conversation, not just a database entry.
Outcomes: A Model for Public Innovation
What started as a pilot in Roskilde expanded to 5 Danish municipalities, supporting 300+ youth annually with a 75% success rate in transitions to employment or education. NExTWORK is now one of the longest-running service design deployments in Denmark, proving that high-touch human services can be scaled effectively through thoughtful digital architecture.
