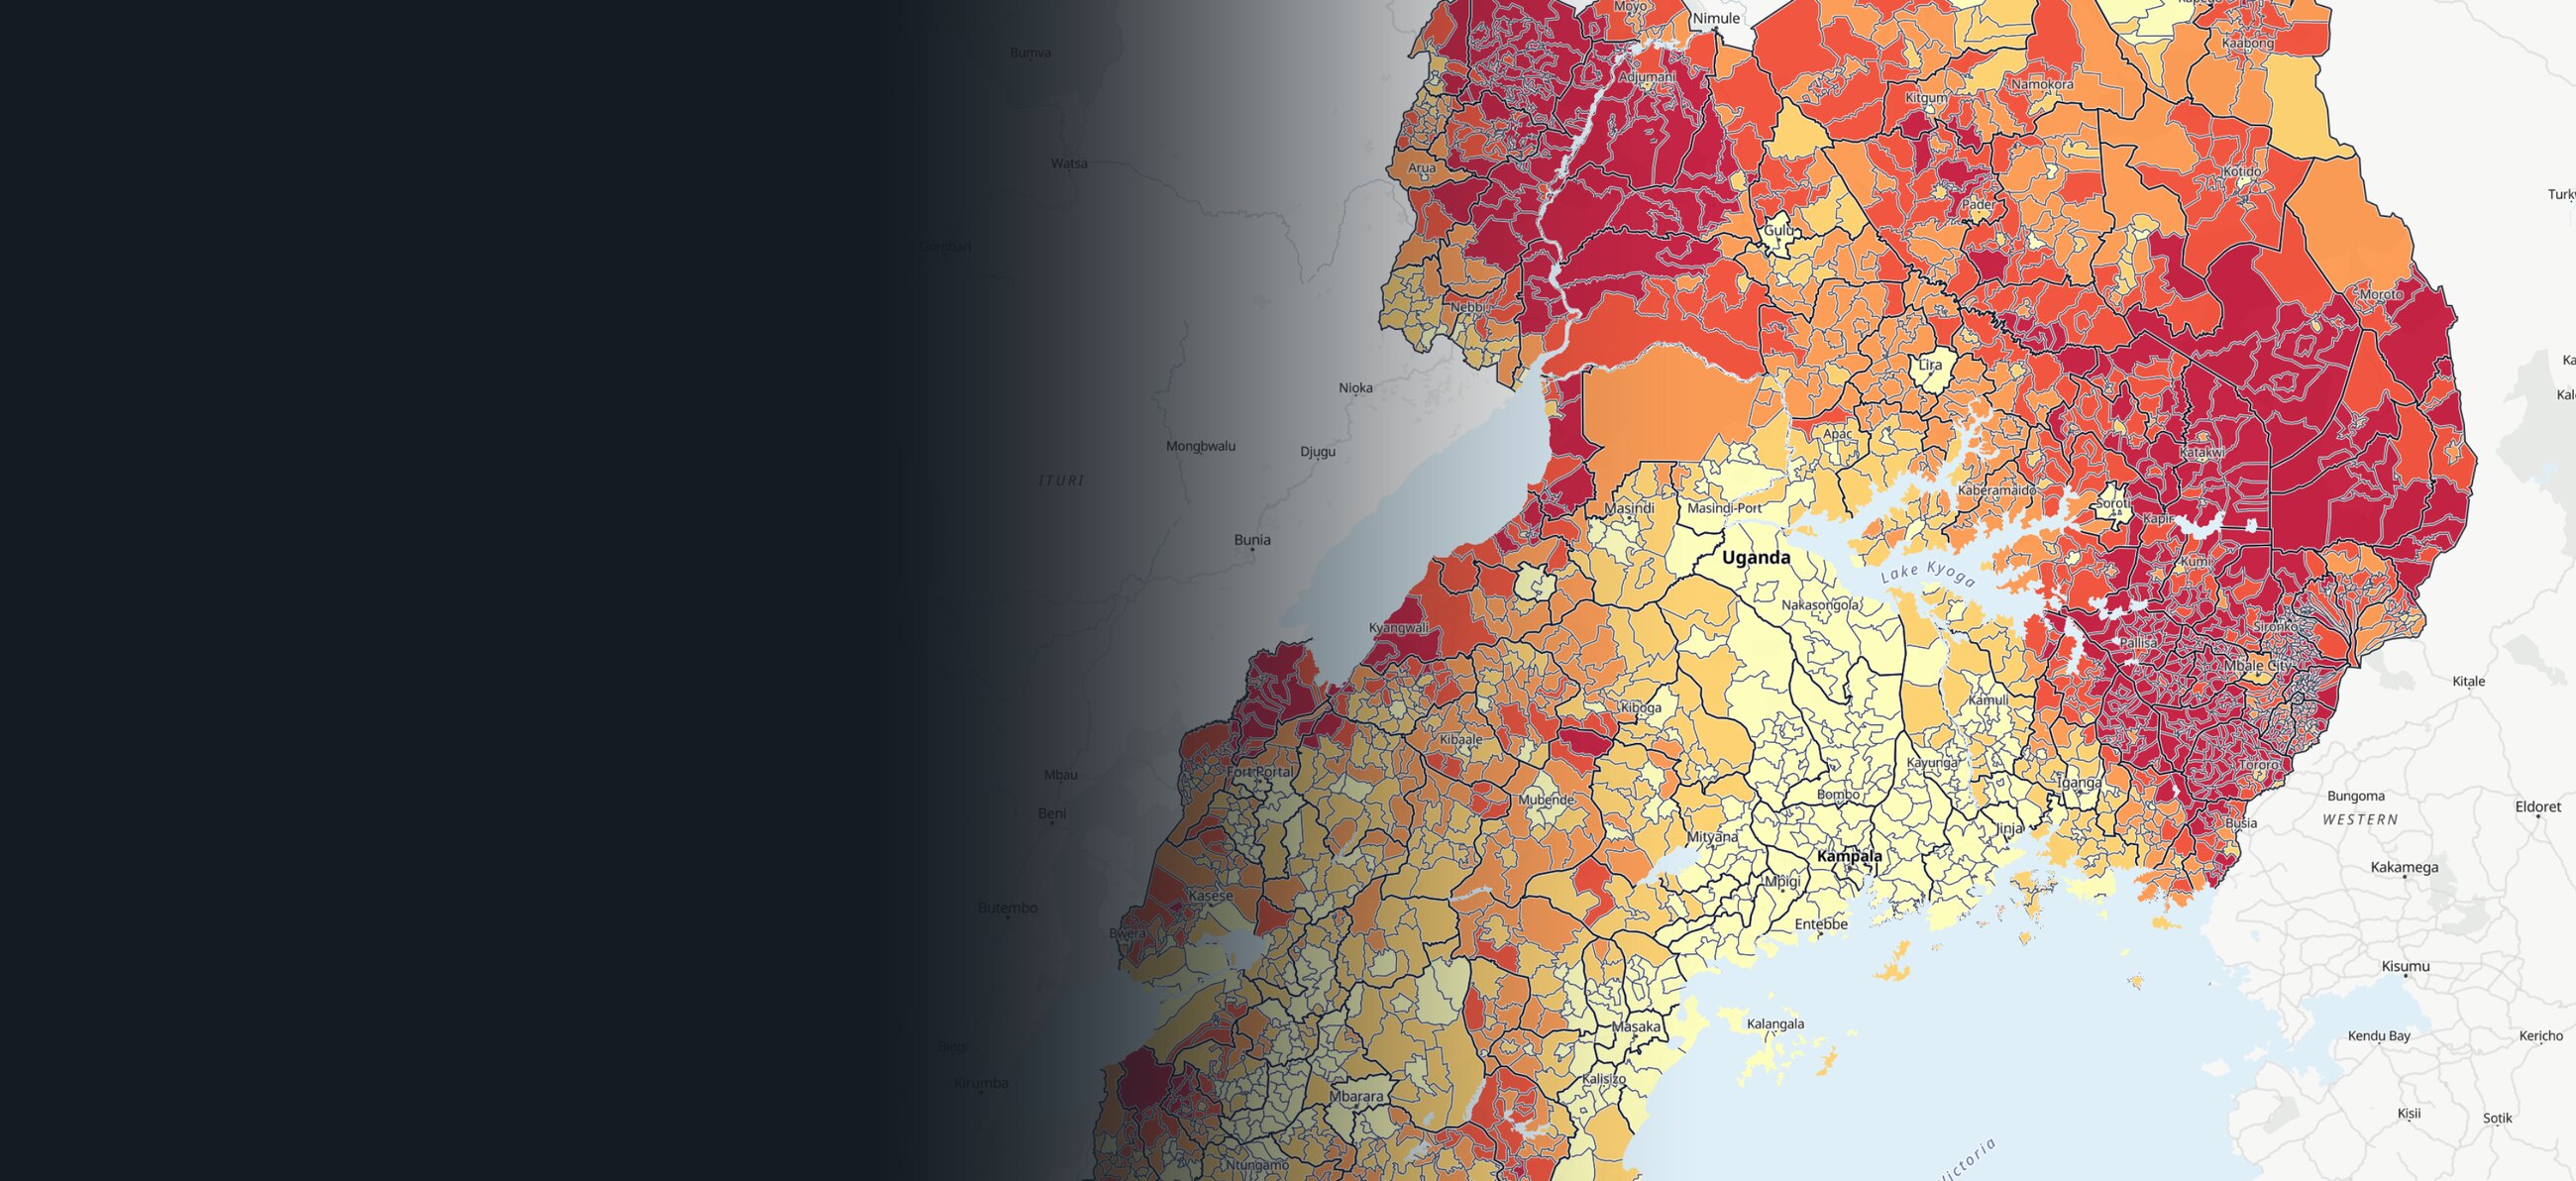
Uganda's Climate Vulnerability and Risk Platform
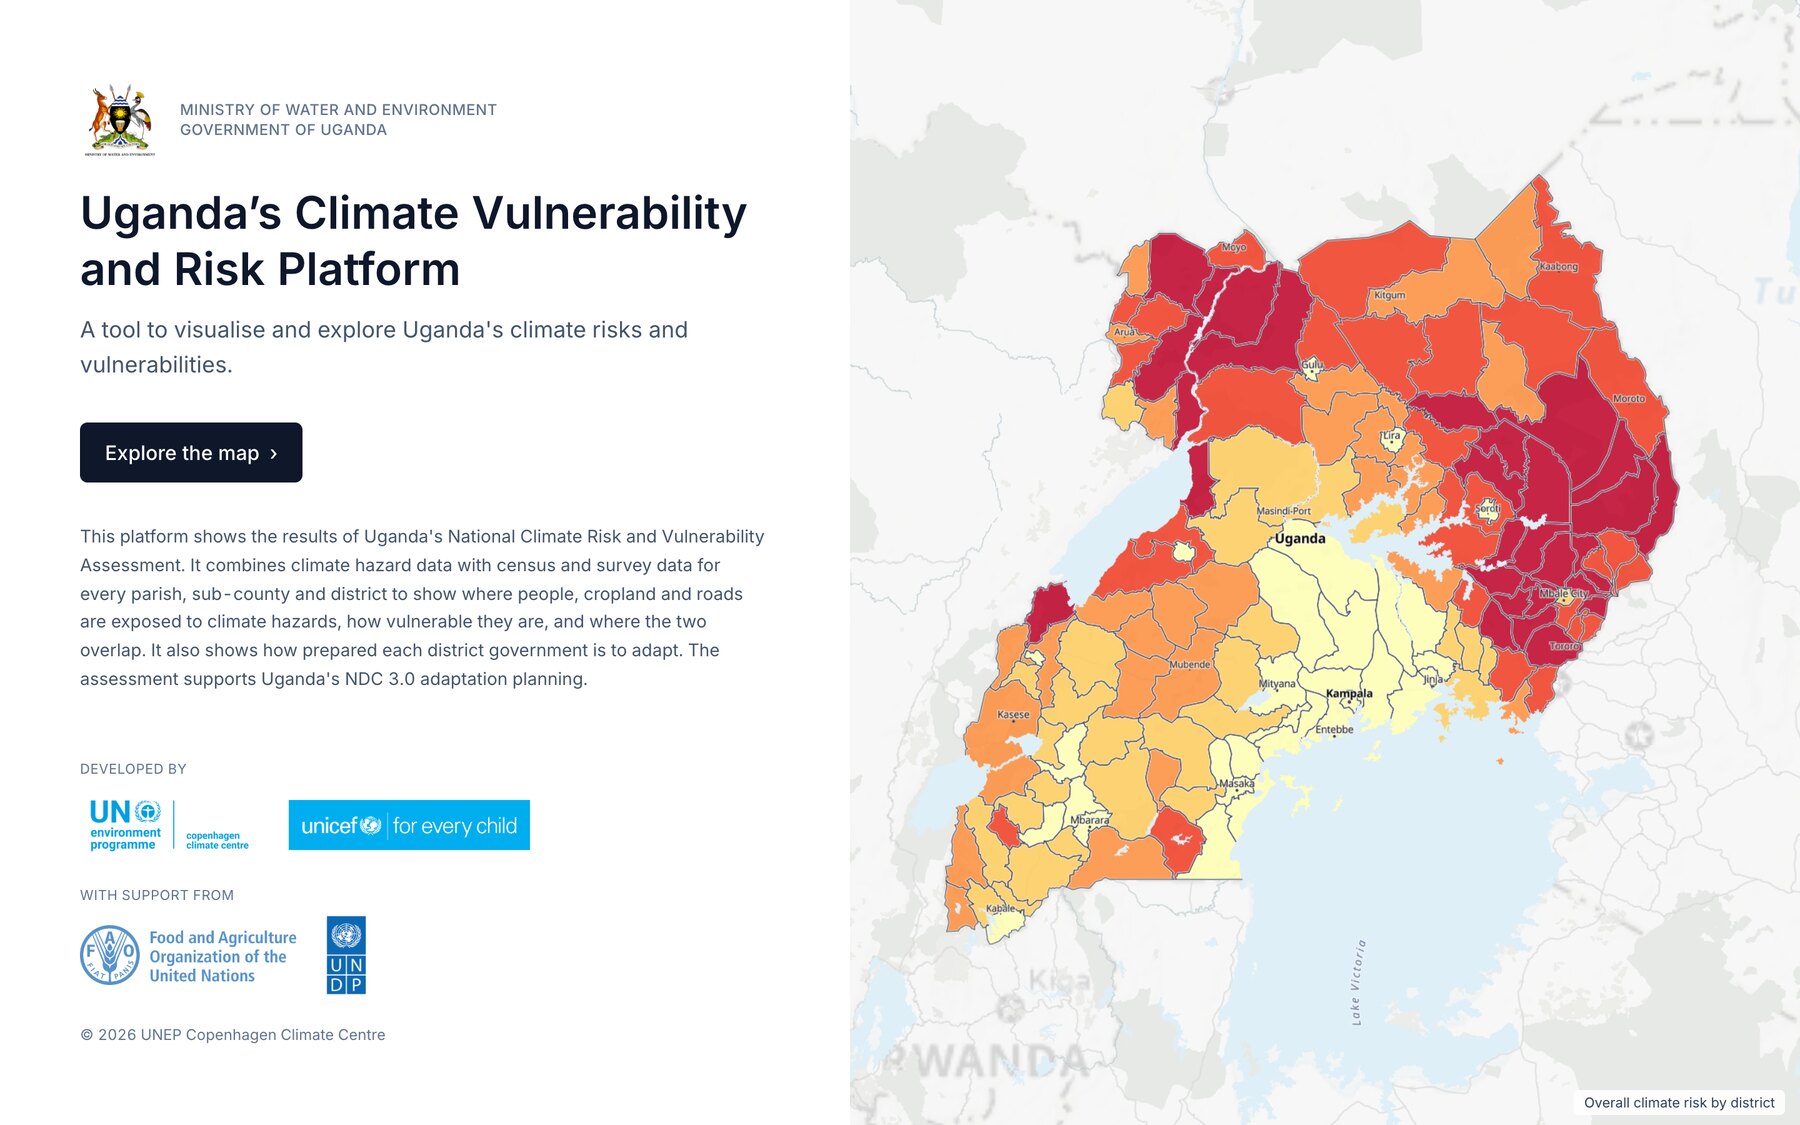
Uganda's national climate risk assessment arrived as three spreadsheets of 10,854 rows each. For UNEP Copenhagen Climate Centre and Uganda's Ministry of Water and Environment, I turned it into a map planners can read down to parish level. The map, the data pipeline, the technical guidance and the user manual took 26 working days.
Client
UNEP Copenhagen Climate Centre
Year
2026
Role
Digital Platform Design Expert
The Brief
Uganda has assessed climate risk for every parish in the country: which hazards hit where, who and what is exposed, how vulnerable they are, and how prepared each district government is. It existed as Excel workbooks, one row per parish.
UNEP Copenhagen Climate Centre hired me to turn that into a map planners and ministry staff can use for Uganda's next national climate plan (NDC 3.0). The contract was 26 working days for three deliverables: the map, a data package with technical guidance so the team in Uganda can maintain it, and a user manual. A specialist produced the indices. I did the design and the engineering.
A Faithful Map Is a Flat Map
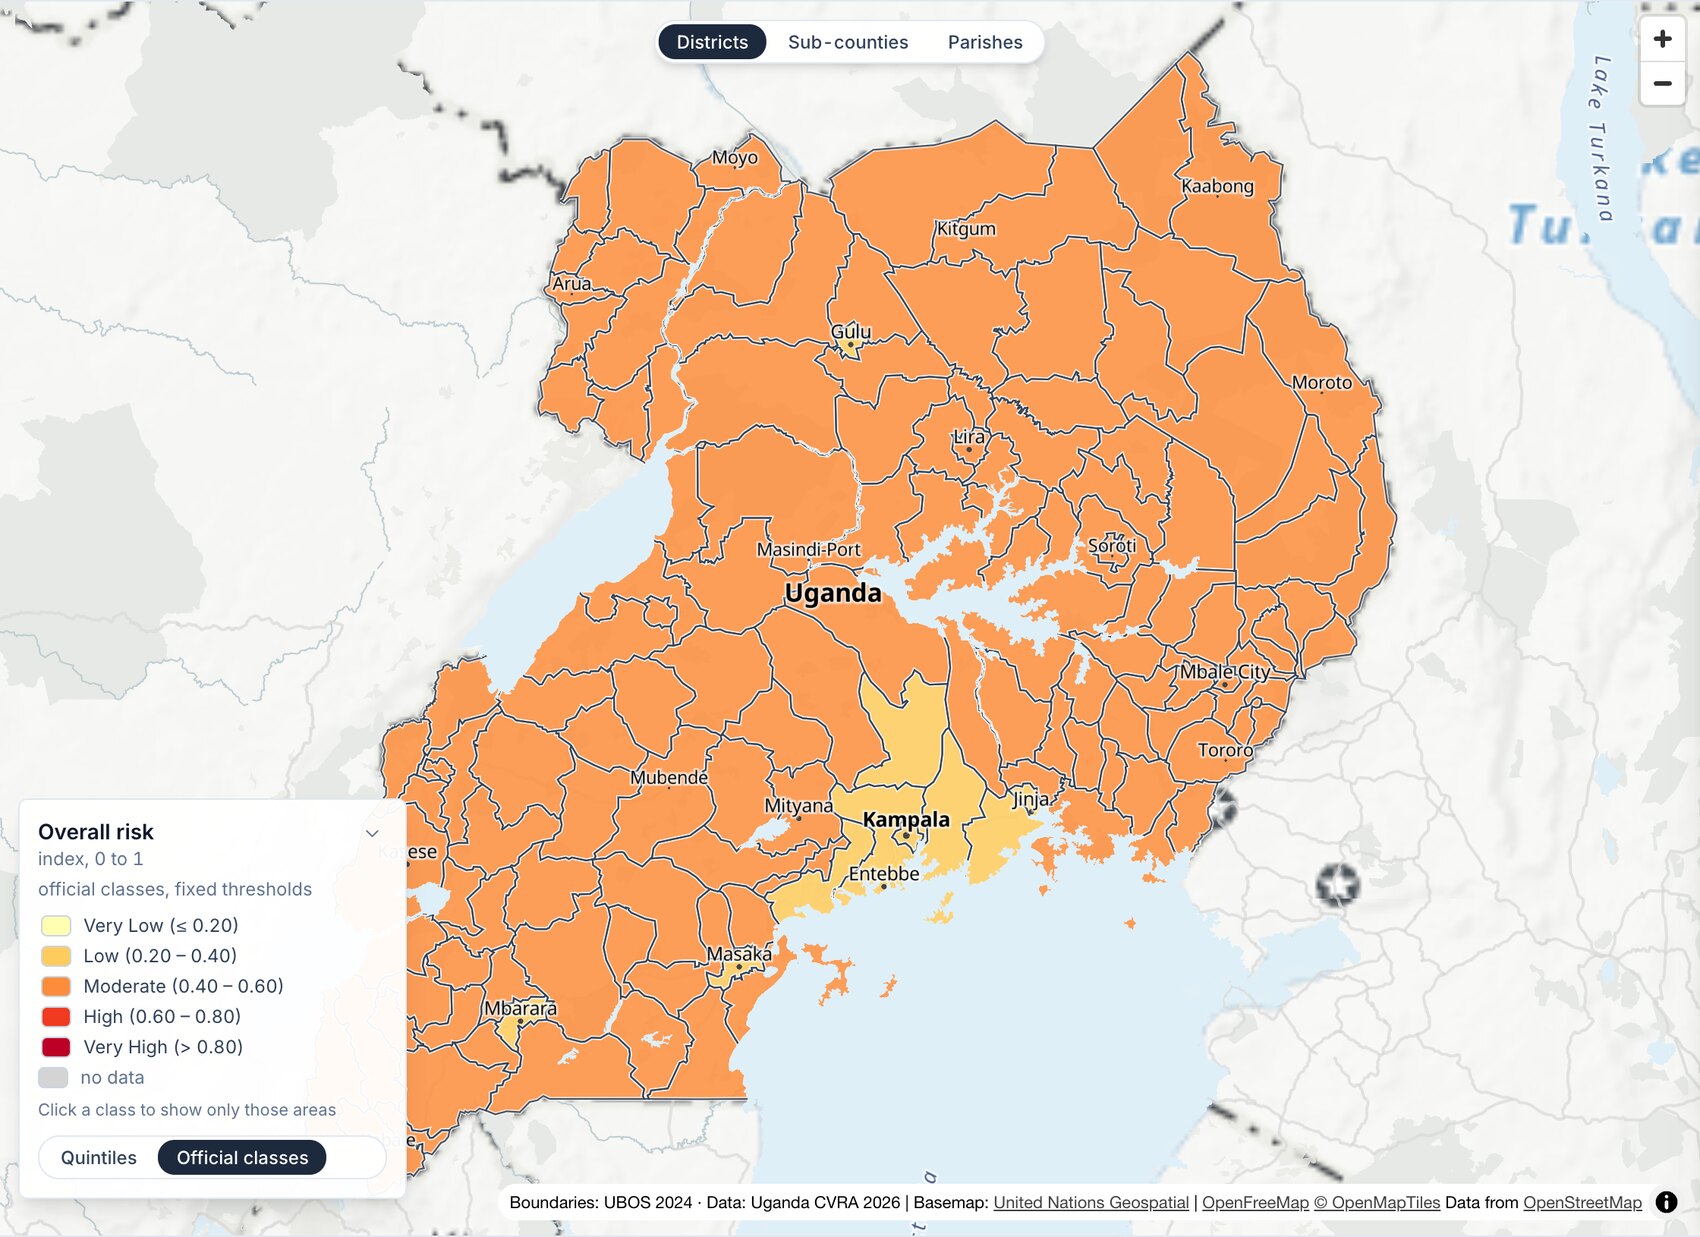
The assessment sorts every score into five official classes, Very Low to Very High. Coloured that way, the map is one colour. Overall risk runs from 0.27 to 0.64, and 91% of parishes land in Moderate. Road risk is 100% Moderate. A planner opening that map learns nothing about where to start.
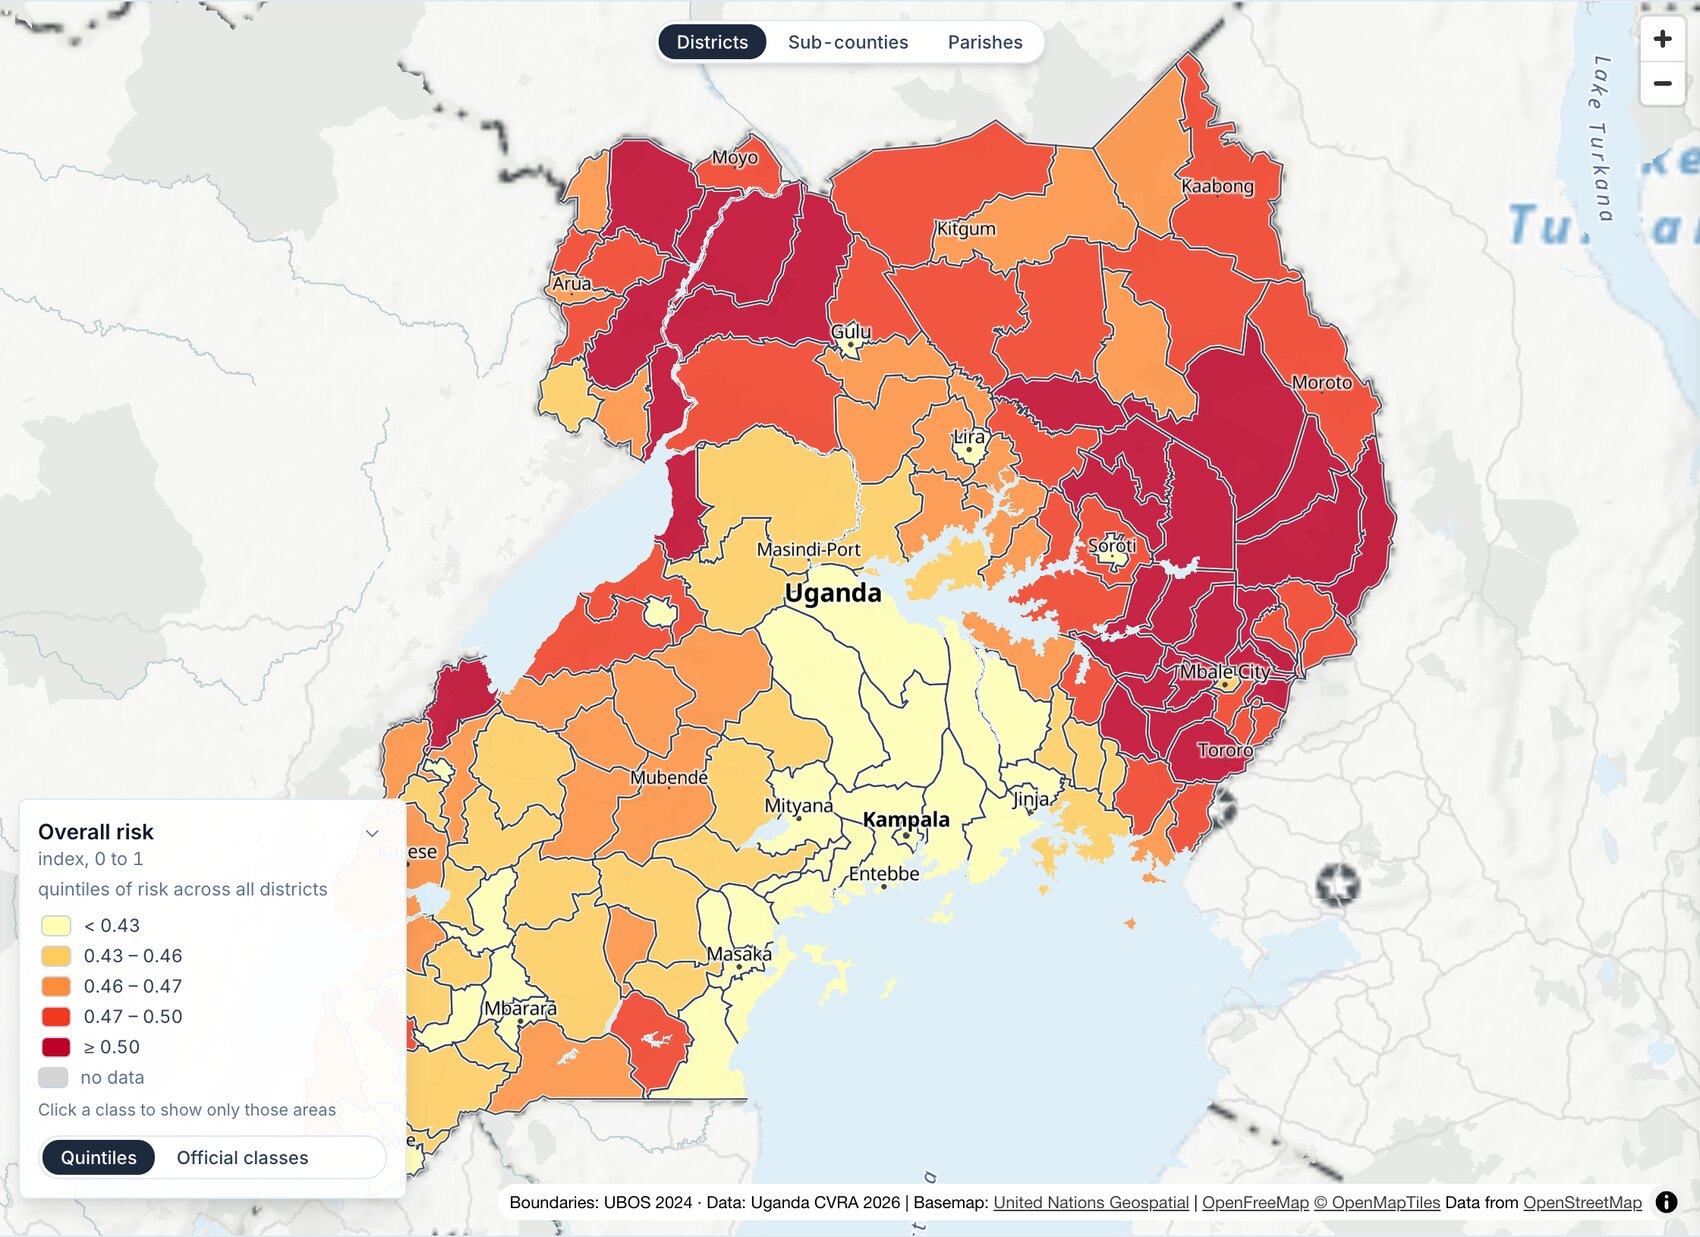
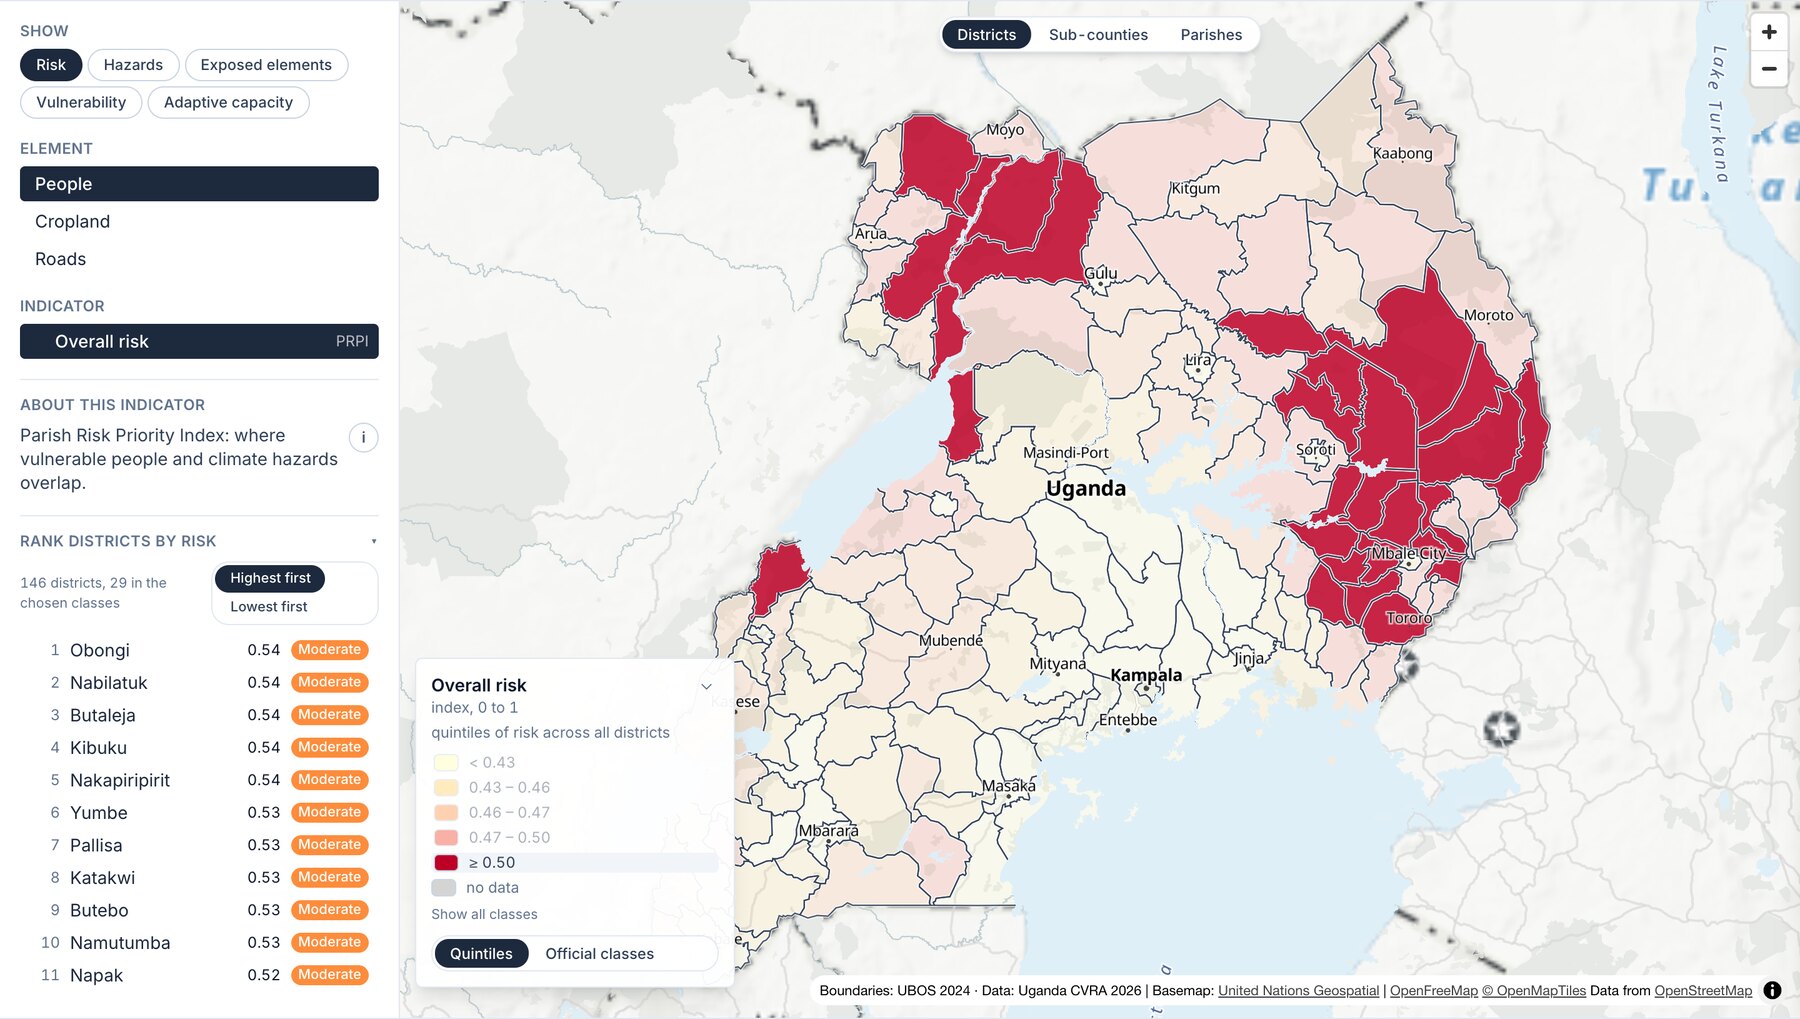
So the map colours by quintiles. Each colour holds a fifth of the areas, and the differences inside Moderate become visible.
That is a trade, and the interface says so. A dark district is in the worst fifth, which is not the same as being rated High. The official class is printed in every tooltip and every panel, the legend gives its breaks in numbers, and one switch puts the official classes back.
Saying No to a 2050 Layer
In the second feedback round the client asked for a 2050 layer: hazards and population at mid-century. The data could not carry it. Projected climate had arrived. Projected population never did. A layer called 2050 would have shown today's people under tomorrow's weather.
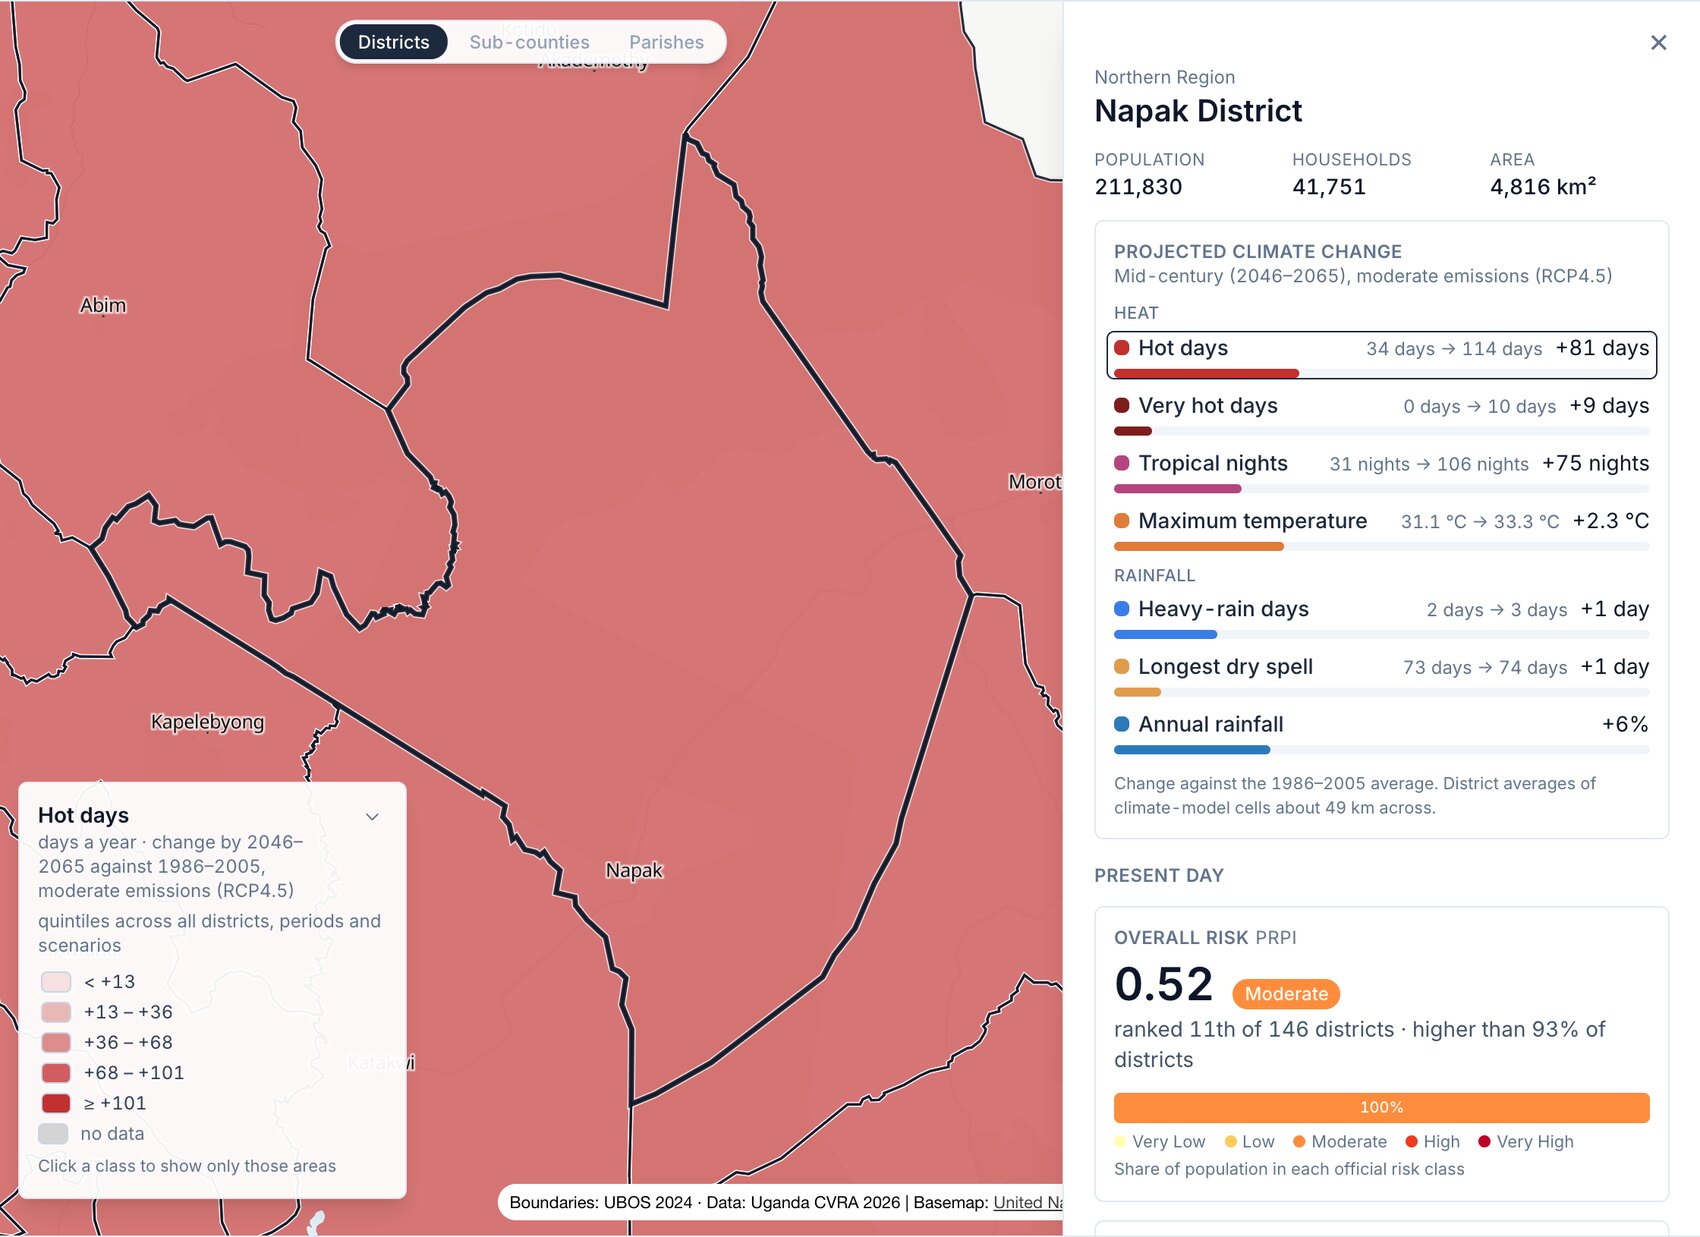
I shipped what the data supports: three twenty-year windows under two emissions scenarios, for seven climate indicators. Napak district goes from 34 hot days a year to 114 by mid-century under moderate emissions. Everything else stays in the present, and the interface says that only the climate is projected.
The same rule set the level of detail. The climate model's grid cells are about 49 km across, larger than 113 of Uganda's 146 districts. Parish-level climate would repeat one cell's value across hundreds of parishes, so the climate layers stop at district level.
What the Data Left Out
Three cases where the data was missing, misplaced or mislabelled, and what the map does about each.
Zero is not none
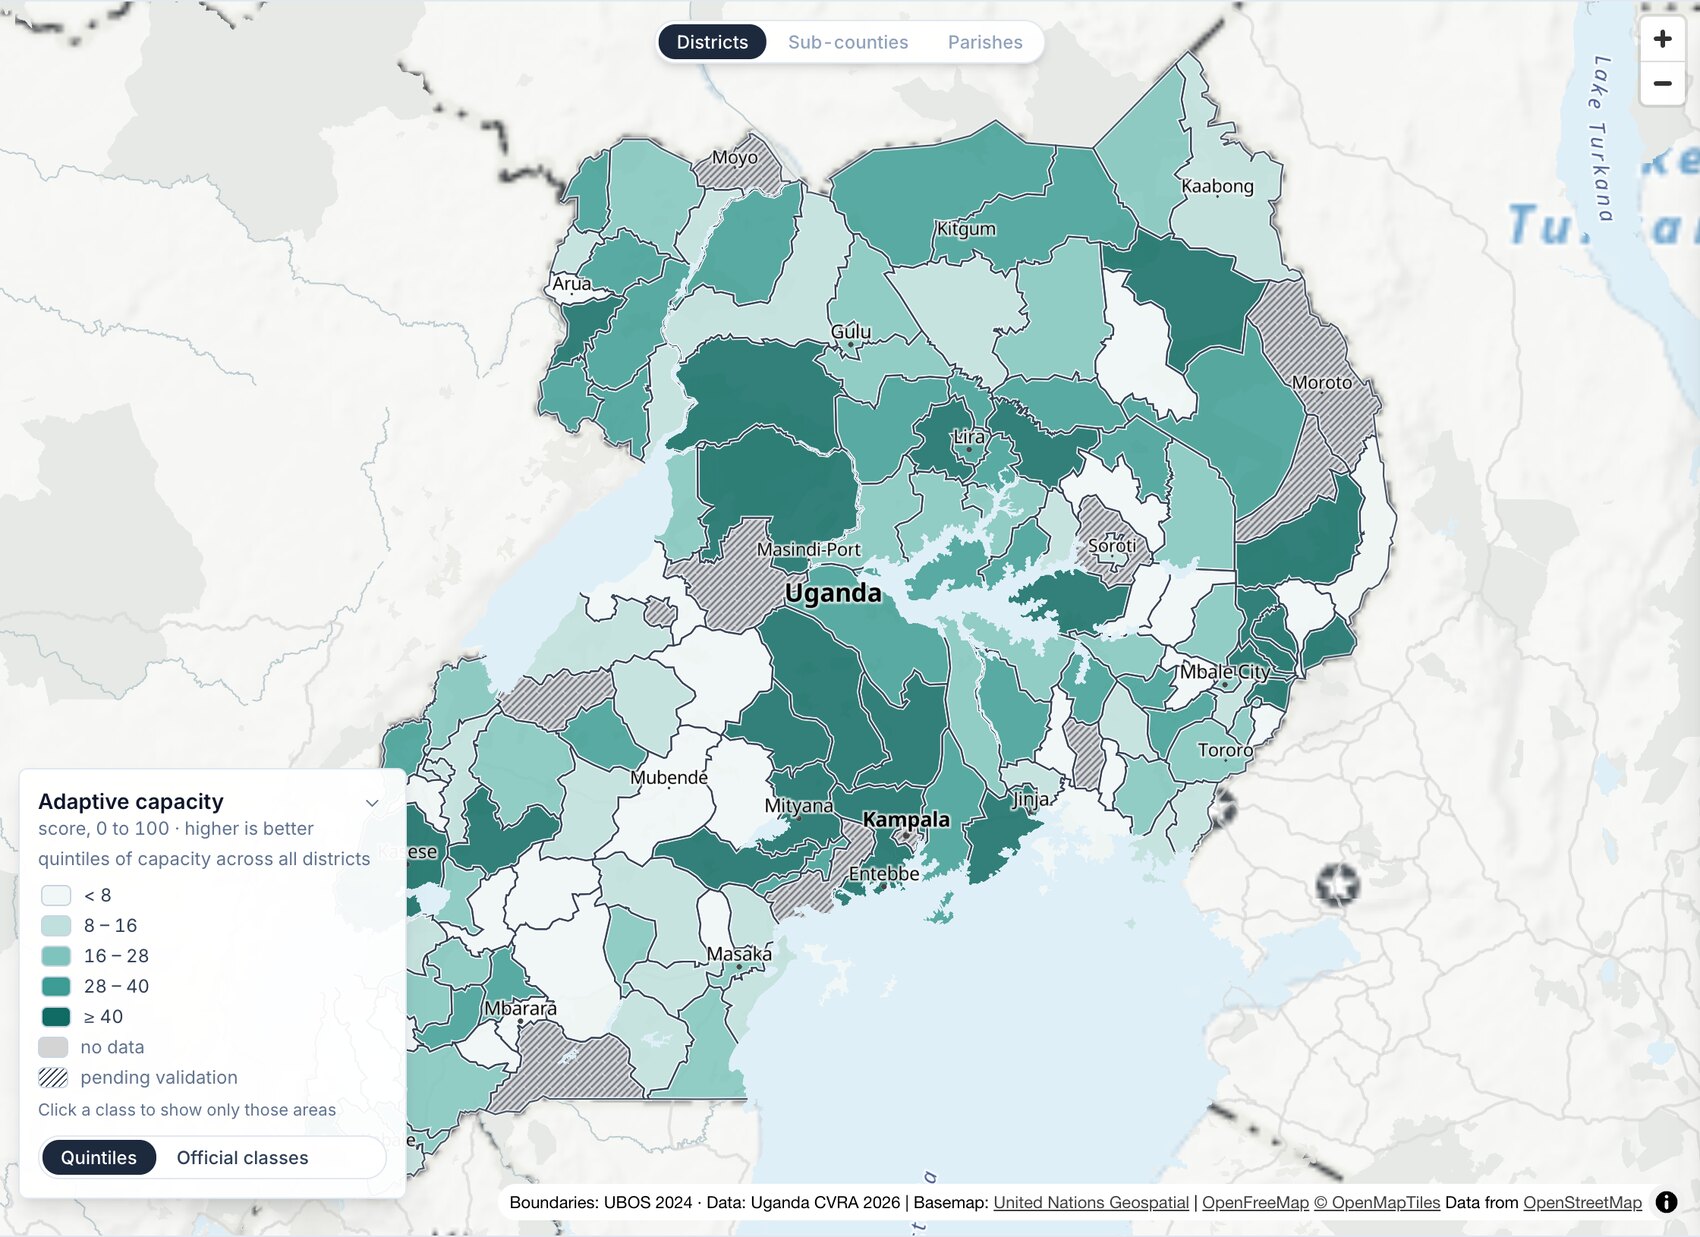
Eleven districts scored zero on adaptive capacity because their assessment was not yet validated. Coloured as data, they would read as the least prepared governments in the country. They are hatched and labelled as not yet assessed.
145 places with no outline
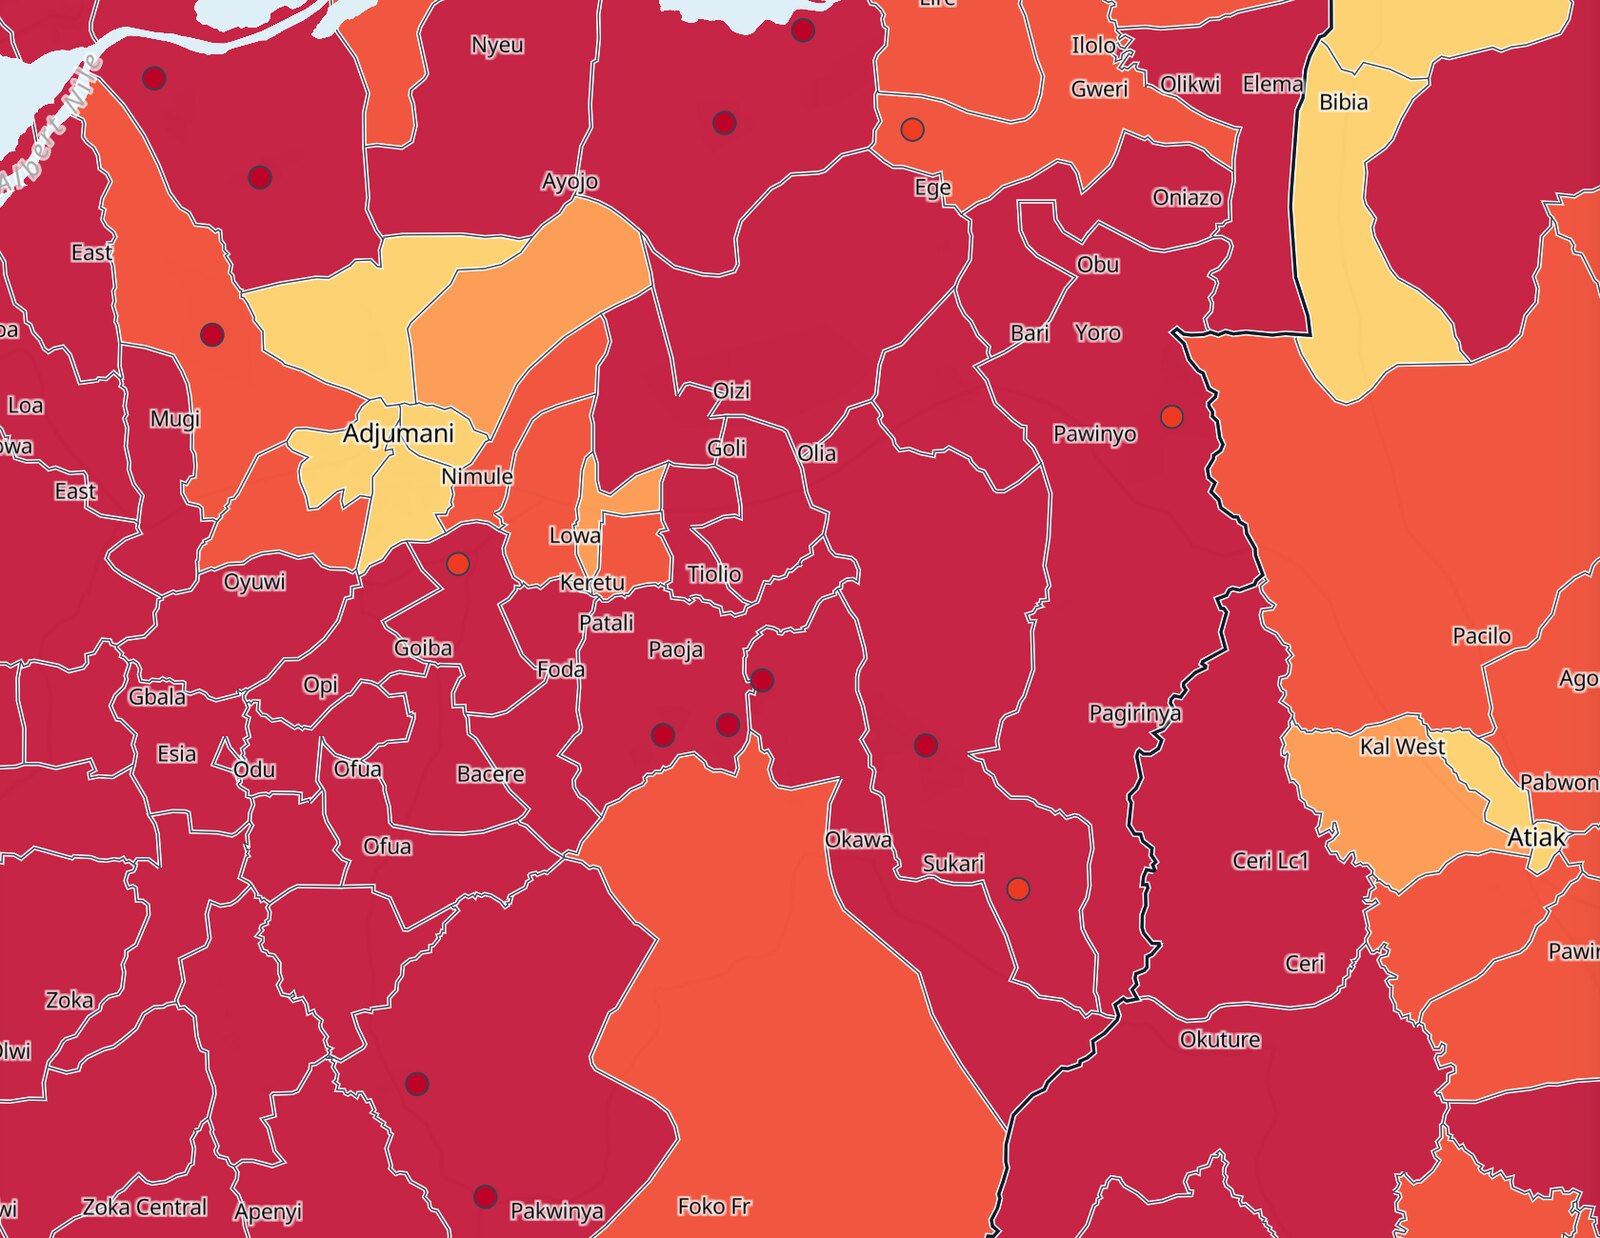
About 830,000 people, most of them in refugee settlements, are in the workbooks and missing from the 2024 parish boundaries. A map built on the boundaries alone drops them. They are drawn as points, with their own values.
A column with the wrong name
In the cropland workbook, the column labelled landslide held the earthquake values, and a risk index had been calculated from it. Recalculating moves 527 parishes into a different class. That is the data owner's decision, not mine. The map shows the data as delivered, the QA report states what it found and what it changes, and the question is still open.
Reading One Place
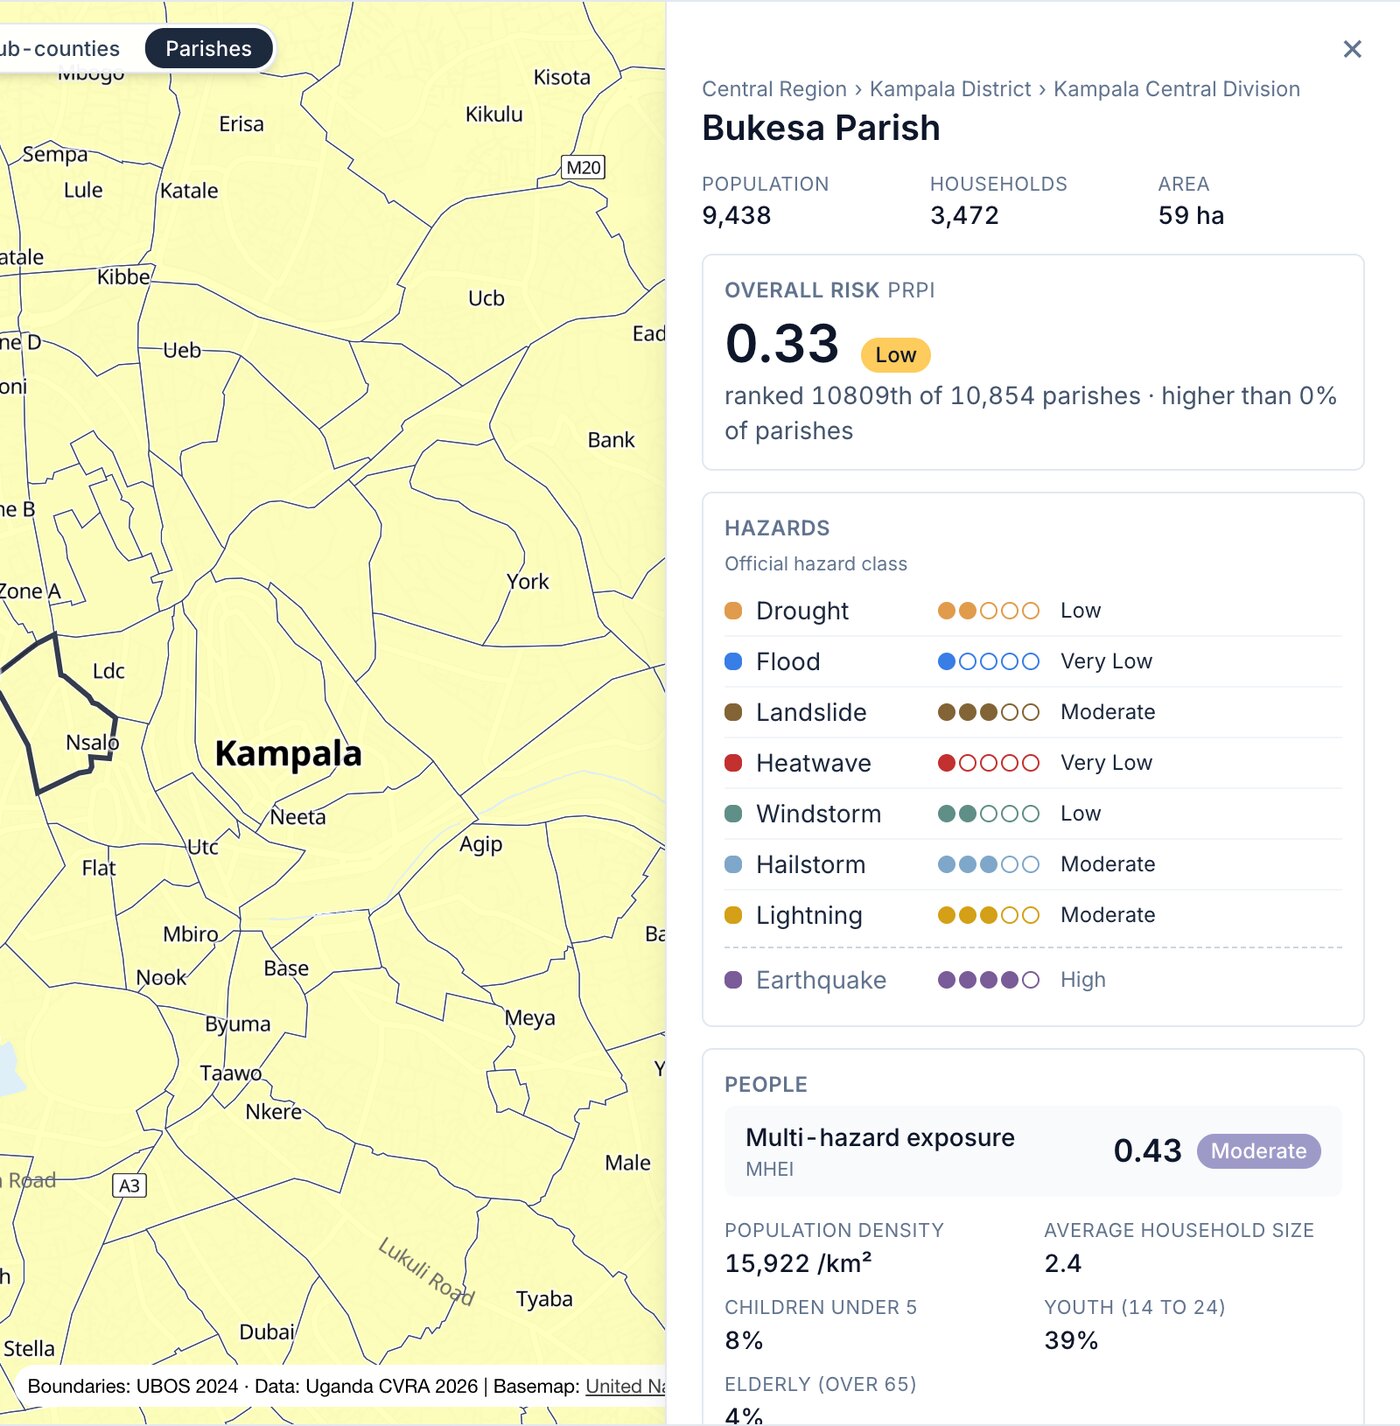
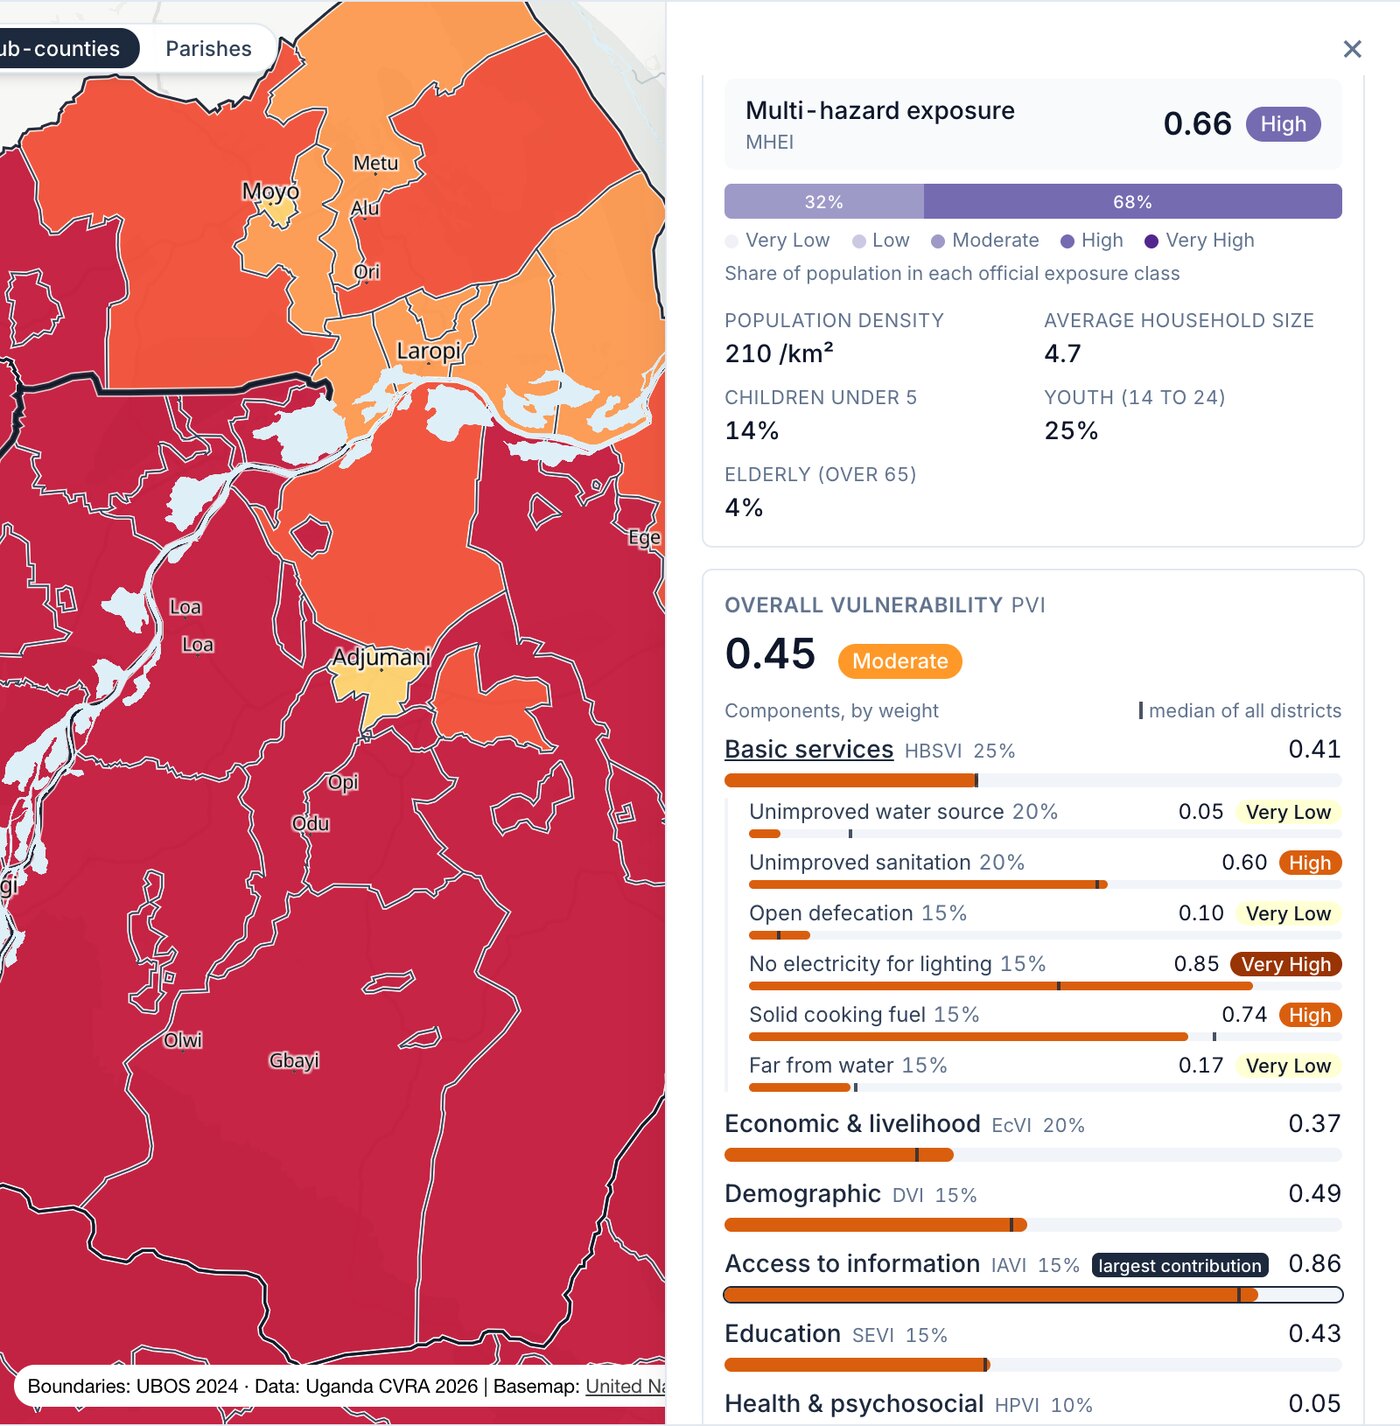
Click a district, a sub-county or a parish, and a panel answers what a planner brings to it: how bad, compared to where, and why. The score comes with its official class and its rank, "12th of 146 districts". Eight hazards sit on five-dot scales. Vulnerability is six bars, weighted the way the assessment weights them, with the national median marked and the largest contributor flagged.
My earlier prototype, built at my previous design studio, also carried adaptation suggestions and rows that were not in the assessment. They came out. Everything in the panel is in the data.
Two Rounds of Feedback
The client reviewed the map twice. Two of the requests changed how it works.
Borders
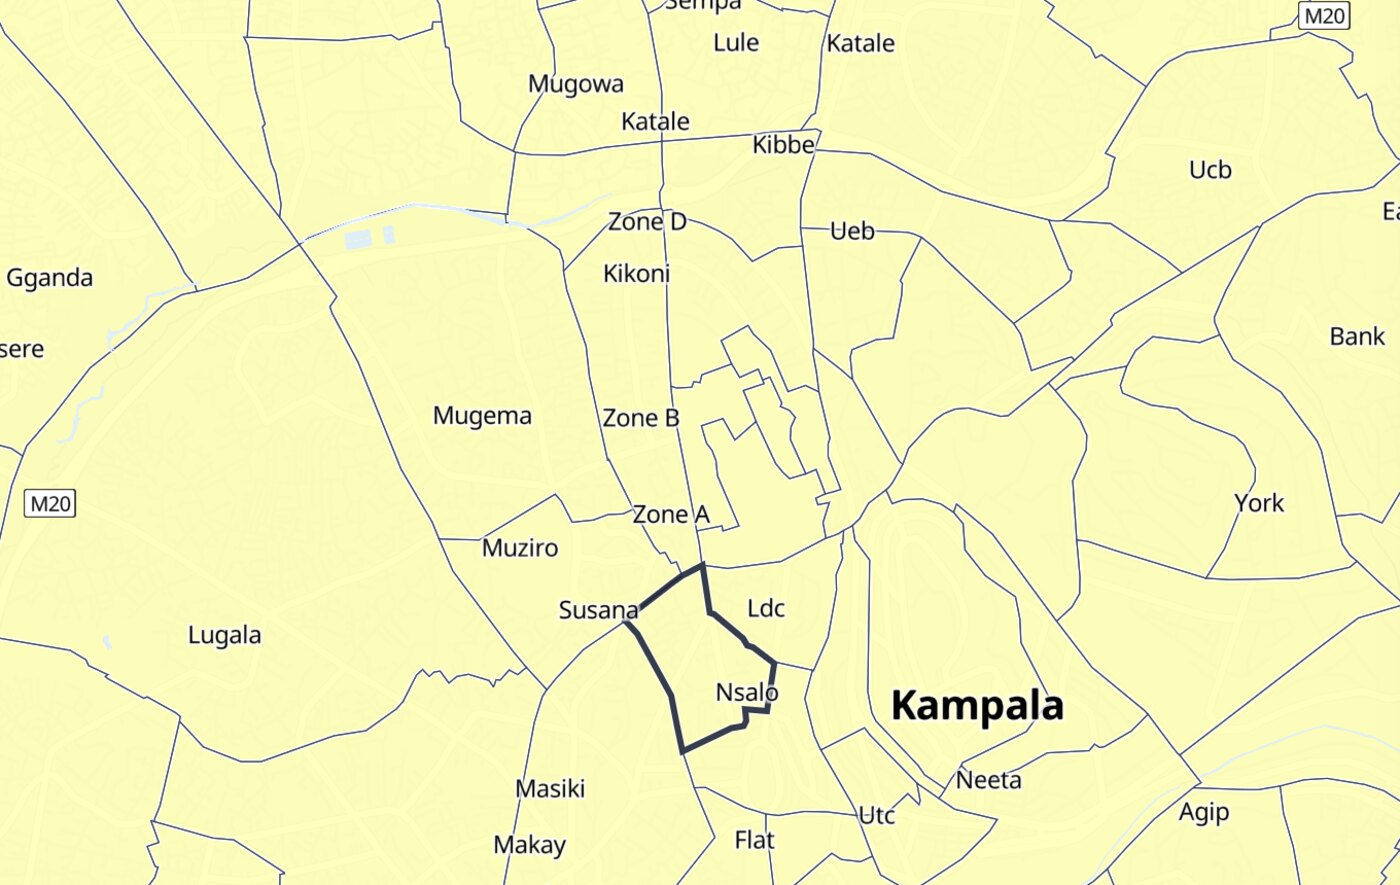
A UN map has to show the UN's borders. The UN basemap carries them but stops at country scale, long before a parish is visible. Closer in, the map hands over to an open basemap with its borders removed, and Uganda's official 2024 boundaries are drawn on top: a dark line over a white halo, so they hold on the palest fill and the darkest.
Ranking
The second round asked for a way to rank districts. The ranking lists districts, or the sub-counties and parishes of the one you selected. Click a class in the legend and both the map and the ranking keep only those areas. The round had five requests. Four were live the same day. The fifth was the 2050 layer.
Handing It Over
The contract ends and the assessment does not. New data will arrive after I am gone.
So the map is a static site: no database, no server, nothing to keep running. It can sit on any web host. Updating it takes two config files and one command. One file says where the data is, the other says what the map shows. Every build writes a QA report in plain language, and a second, independent calculation checks the district figures against the source workbooks.
The technical guidance is written for someone who knows GIS, not for a programmer. Before delivery I rebuilt the whole thing on a different operating system, following only my own instructions.
Outcome
Delivered in November 2026: the map, the data package with its technical guidance, and the user manual. The Uganda team presented it at COP31.
The map is live at indsigtdesign.github.io/uganda-cvra-map.